Figure 5.
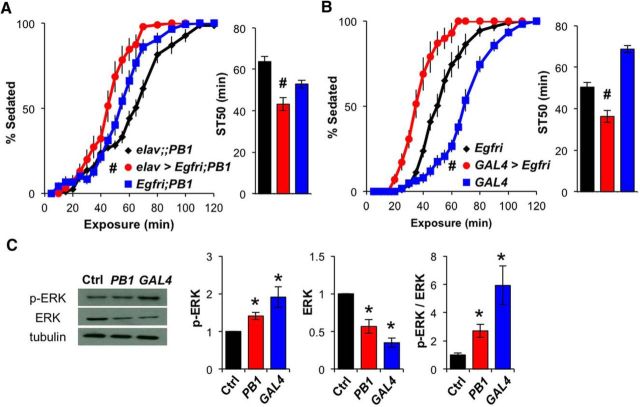
Inhibition of downstream EGFR/ERK signaling mitigates the DopEcR mutant phenotype in ethanol-induced sedation. A, Pan-neuronal expression of Egfr-RNAi in DopEcRPB1 mutants. Left, Percentage of flies exhibiting sedation. Right, ST50; elav>Egfri; PB1 (elav-GAL4/Y;UAS-Egfr-RNAi/+;DopEcRPB1, n = 10), elav;; PB1 (elav-GAL4/Y;;DopEcRPB1, n = 13), and Egfri;PB1 (UAS-Egfr-RNAi/+;DopEcRPB1, n = 9). B, Expression of the Egfr-RNAi in DopEcRGAL4 mutants using its GAL4 activity; GAL4>Egfri (UAS-Egfr-RNAi;DopEcRGAL4, n = 10), RNAi (UAS-Egfr-RNAi, n = 8), and GAL4 (DopEcRGAL4, n = 13). Knockdown of EGFR expression in DopEcRPB1 (A) or DopEcRGAL4 (B) mutants significantly increased their sensitivity to ethanol-induced sedation. C, Left, Representative Western blots for basal p-ERK, total ERK, and α-tubulin in head lysates of Ctrl (w1118), PB1 (DopEcRPB1), and GAL4 (DopEcRGAL4) flies. Right, Densitometric quantification of the bands (n = 4). All figures display averages with SEM, with two-way repeated-measures ANOVA on ranks, Holm–Sidak (A and B, left), Mann–Whitney rank-sum tests (A and B, right), and ANOVA on ranks, Dunn's versus control (C). #p < 0.05 from both RNAi and GAL4 controls and *p < 0.05 from the wild-type control.

