Figure 1.

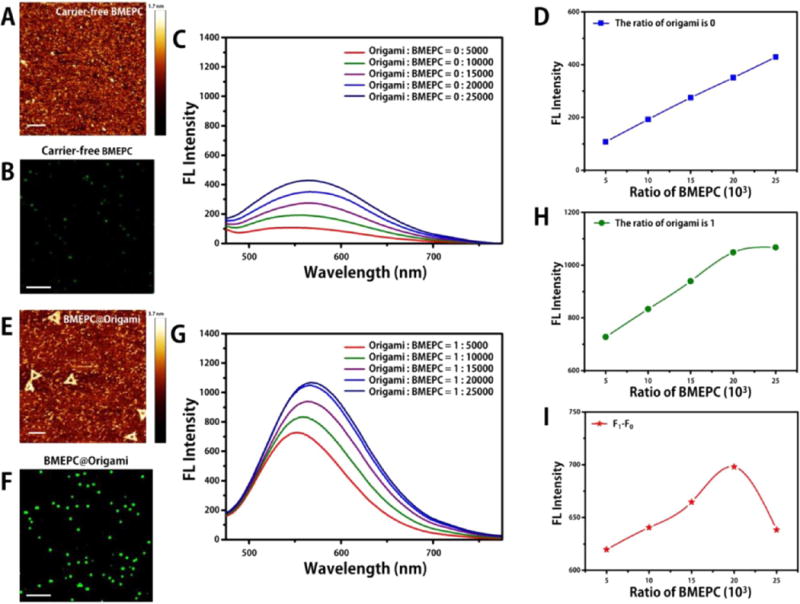
Carrier-free BMEPC (A, B, C, D). (A) AFM image of carrier-free BMEPC in ddH2O, the scale bar is 200 nm. (B) CLSM image of carrier-free BMEPC in ddH2O, the scale bar is 2 μm. (C) Fluorescence spectra of carrier-free BMEPC in ddH2O. (D) Fluorescence emission of the maximum peak intensity corresponding to different BMEPC ratios in carrier-free BMEPC. BMEPC-loaded DNA origami (E, F, G, H). (E) AFM image of BMEPC-loaded DNA origami in ddH2O, the scale bar is 200 nm. (F) CLSM image of BMEPC-loaded DNA origami in ddH2O, the scale bar is 2 μm. (G) Fluorescence spectra of BMEPC-loaded DNA origami of different BMEPC molar ratios in ddH2O. (H) Fluorescence emission of the maximum peak intensity corresponding to different BMEPC ratios in BMEPC-loaded DNA origami. (I) Difference of fluorescence emission between BMEPC-loaded DNA origami and carrier-free BMEPC under the same ratio of BMEPC molecules, using the corresponding points in (H) minus those in (D).
