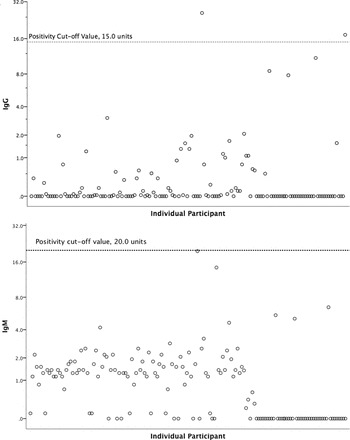
Figure 1.

Scatter plots of serum Histoplasma Enzyme Immunoassay IgG and IgM results. Note : Figure 1a displays the results of serum EIA Histoplasma IgG testing with the positive cutoff noted by a horizontal line at 15 units and the positive results at 26 and 17 units. Figure 1b displays serum IgM EIA results with the positive cutoff noted by a horizontal line at 20 units.
