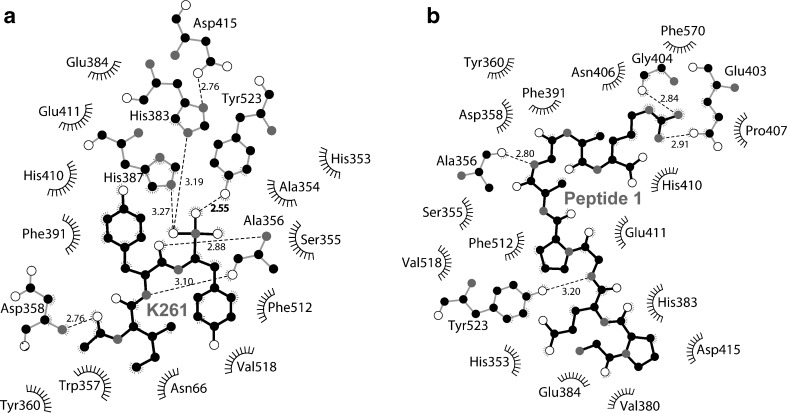
Fig. 3.
Two-dimensional schematics summarizing the key interactions between the ligands (black sticks) and the active site of ACE (gray sticks) analyzed by Ligplot (Wallace et al. 1995); (a) K-26 inhibitor, and (b) peptide 1. Dashed lines indicate hydrogen bonding and ‘eyelash’ curves show unbonded hydrophobic interactions. Key amino acid residues of the enzyme for the binding are indicated. White atoms are oxygen and gray atoms are nitrogen. Distances of key interactions are indicated

