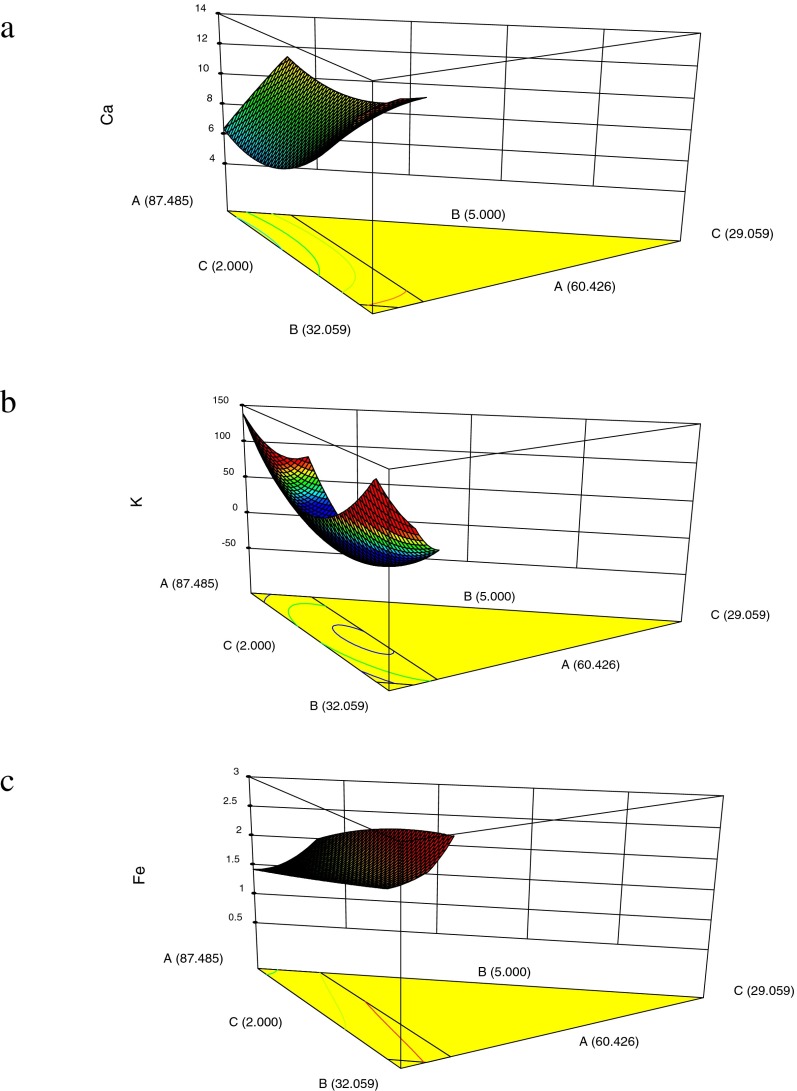
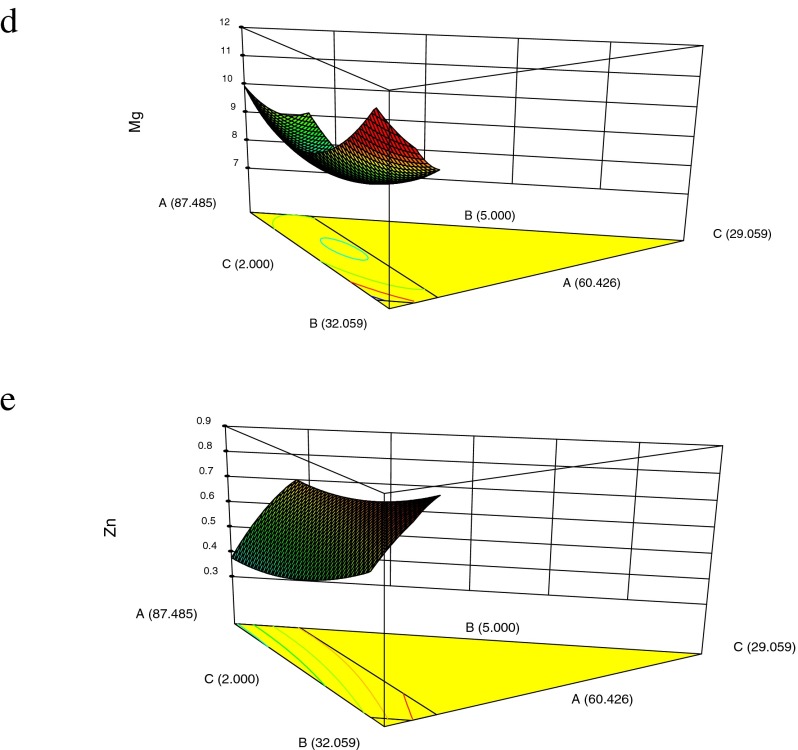
Fig. 2.
a: 3D graphical representation of the effect of composite flour on calcium b: 3D graphical representation of the effect of composite flour on potassium c: 3D graphical representation of the effect of composite flour on iron d: 3D surface graphical representation of the effect of composite flour on Magnesium e: 3D graphical representation of the effect of composite flour on zinc


