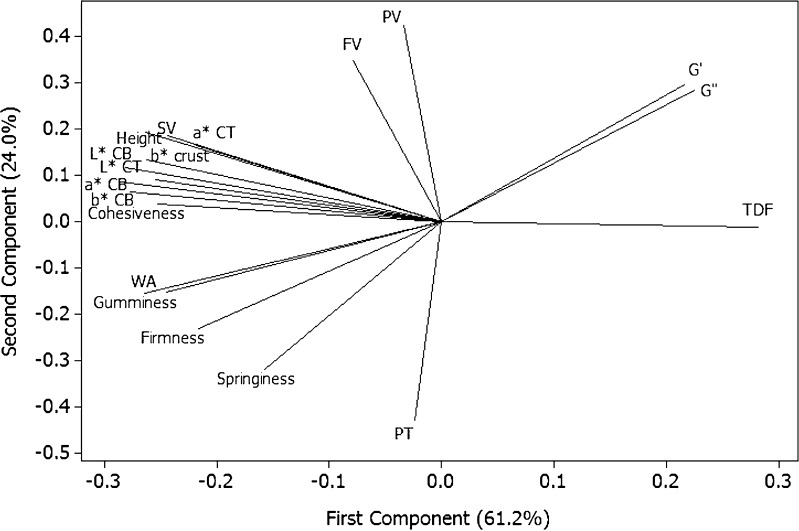
Fig. 1.
PCA loading plot showing relations between various tests performed of BCF incorporated rice muffins with/without XG (PV peak viscosity, FV final viscosity, PT peak temperature, CT crust, CB crumb, SV specific volume, TDF total dietary fibre, WA water activity; G′ storage modulus; G″ loss modulus)

