
Figure 2.
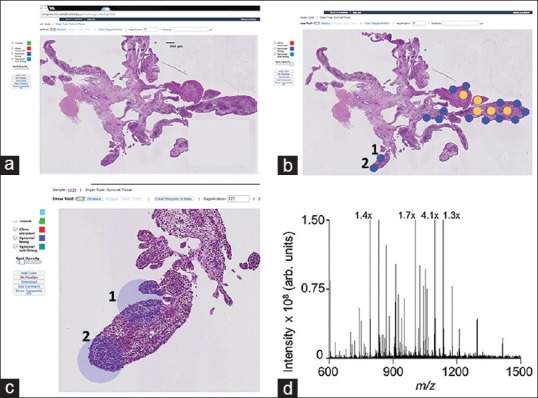
Screenshots from the pathology interface for mass spectrometry interface highlight the software features and workflow. (a) A scanned H and E stained tissue section can be viewed through the image markup screen and examined remotely by a pathologist. (b) The pathologist can then annotate the tissue via a user-defined color palette to distinguish regions of interest, for example, tissue classes (e.g., normal versus disease) or cell types. Annotations can be made as discrete spots (as shown) or regions. (c) Pathology interface for mass spectrometry can zoom to regions of interest. Scale bars and the magnification level are automatically rescaled according to the zoom level. (d) A mass spectrometry spectrum acquired from the spot labeled “1” in panels b and c