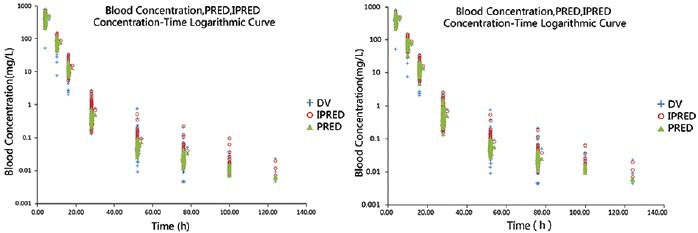
Figure 4.

Observed concentration (DV; semilog), individual predicted concentration (IPRED; semilog) and population predicted concentration (PRED; semilog) versus TIME in the base model (a) and the final model (b). The blue crosses represent the DV, the red blank circles represent the IPRED and the yellow triangles represent the PRED.
