Figure 2.

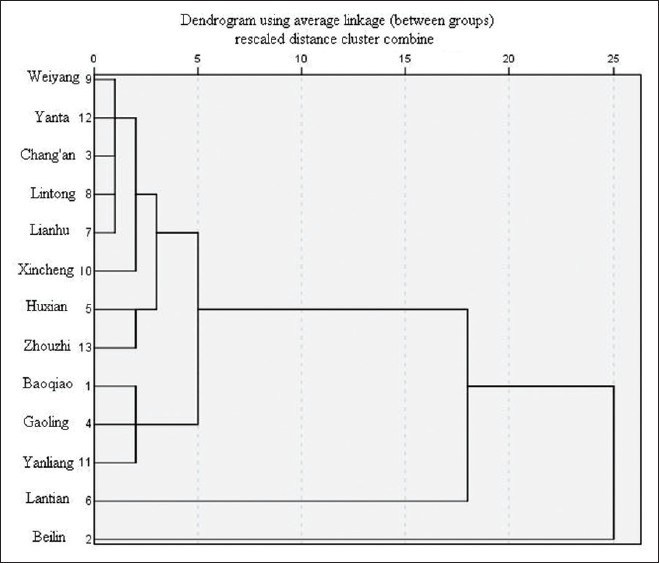
Hierarchical cluster analysis of cumulative incidence of common birth defects in 13 counties and districts during 2003–2012.

Hierarchical cluster analysis of cumulative incidence of common birth defects in 13 counties and districts during 2003–2012.