
Figure 2.
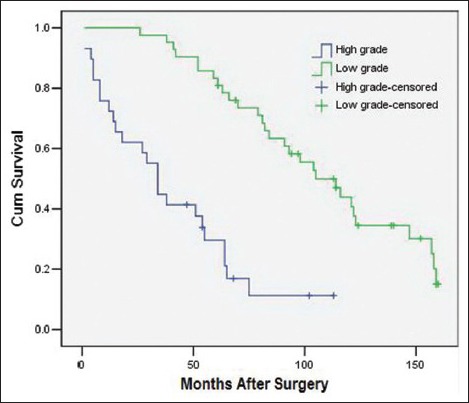
Survival rates as a function of the tumor grade (high grade vs. low grade, P = 0.006, RR = 2.70 [95% confidence interval 1.34, 5.45], 71 patients).
Official websites use .gov
A
.gov website belongs to an official
government organization in the United States.
Secure .gov websites use HTTPS
A lock (
) or https:// means you've safely
connected to the .gov website. Share sensitive
information only on official, secure websites.
Survival rates as a function of the tumor grade (high grade vs. low grade, P = 0.006, RR = 2.70 [95% confidence interval 1.34, 5.45], 71 patients).