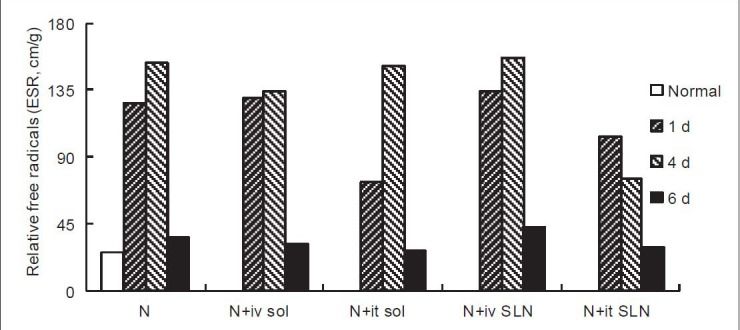
Figure 3.

Changes in ROS generation by ESR technology in guinea pigs. Animal grouping, noise exposure methods, and statistical treatment are consistent with Figure 1. ΔROS = Relative value of ROS, ΔROS = h/w (cm/g). ΔROS was statistically different by time after noise exposure compared to normal animals, and statistically different by drug administered group from the noise exposure group. The ROS level of the intravenous injected edaravone solution and intravenous injected edaravone SLNs groups remained elevated on the 1st day, and the intratympanic injected edaravone solution and intravenous injected edaravone SLNs groups remained elevated on the 4th day, while the edaravone SLNs groups showed some recovery on the 6th day. */†P < 0.05, P < 0.01.
