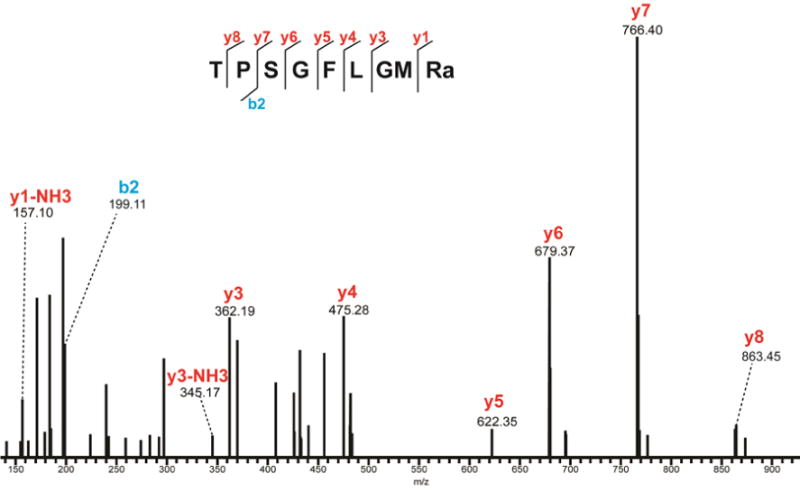
Figure 4.

MS/MS spectrum of CabTRP-II from microdialysate under HCD fragmentation. Peaks are annotated with their corresponding b- and y-ions. The presence of b- and y-ions is indicated by lines above (y-ions) or below (b-ions) the corresponding amino acid residues in the peptide sequence.
