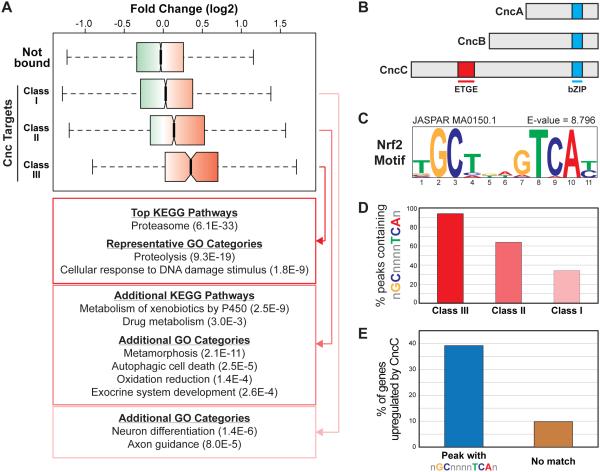
Figure 1. Genes targeted by Cnc/Nrf2 in Drosophila.
(A) Boxplot representing the range of gene expression changes in response to CncC overexpression for genes not bound by Cnc and the Class I, II, and III Cnc/Nrf2 targets. Gene expression profiling data are from [45] and and can be found under GEO Accession Number GSE30087; fold change represents expression in adult flies transiently overexpressing CncC relative to wild-type adult flies. (B) Schematic representation of the three Cnc isoforms. The Keap1 interaction region (ETGE) and DNA binding region (bZIP) are highlighted. (C) The NRF2 consensus motif (ARE), which is the top enriched motif in the Class III peaks as determined by i-cisTarget. (D) Graph representing the fraction of Class I, II, or III peaks containing a match to the general ARE consensus GCnnnnTCA (E) Graph representing the percent of CncC-induced genes as defined in [45] that are targeted by Cnc/Nrf2 via a peak that contains an ARE versus those targeted by Cnc/Nrf2 via a peak that does not contain an ARE.

