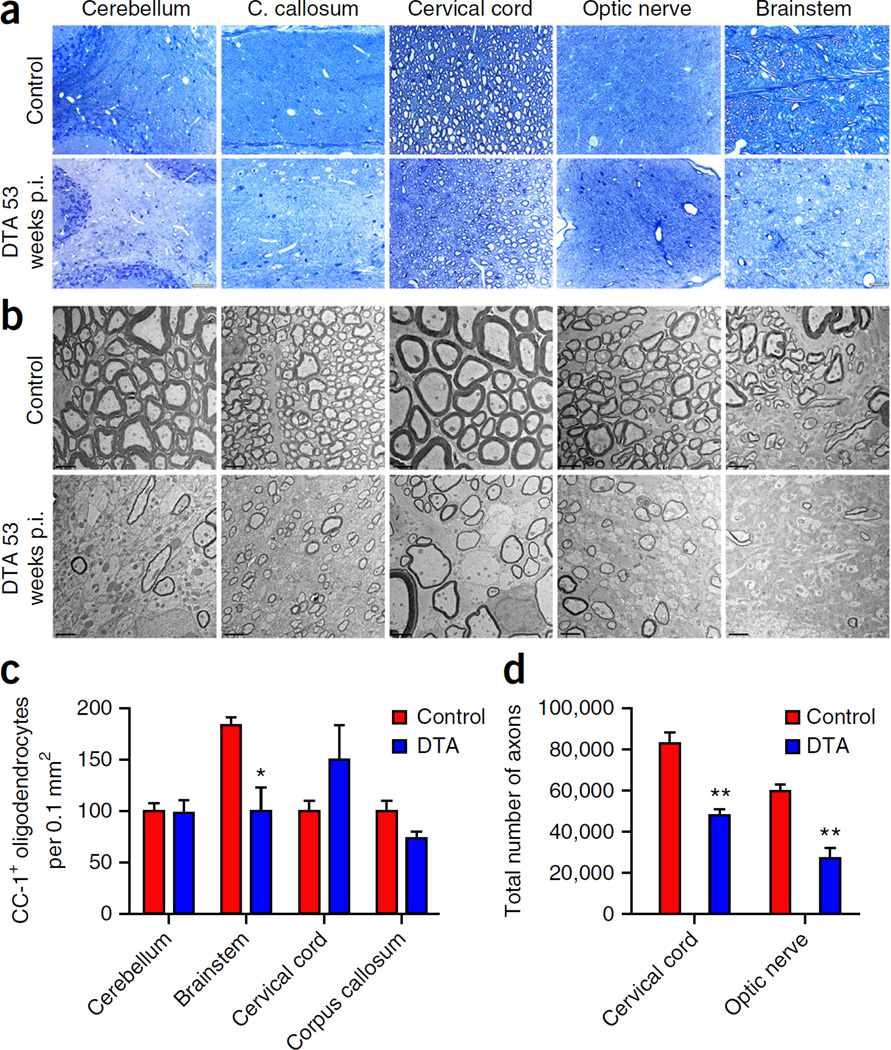
Figure 3.
Extensive myelin and axonal loss at late disease stages. (a,b) Toluidine blue staining (a) and EM analysis (b) showed substantial myelin loss in different CNS white-matter-rich areas of the tamoxifen-treated DTA mice at later disease stages, 53 weeks post-injection (p.i.). Corresponding CNS areas from the control littermate (ROSA26-eGFP-DTA) mice are shown in the upper panel. Scale bars: 100 µm (a, cerebellum), 20 µm (a, corpus (C.) callosum, cervical cord, optic nerve, brainstem) and 2 µm (b). Images in a and b are representative of three mice per genotype. (c) Counts of the CC-1-positive cell numbers indicated significant oligodendrocyte loss in the brainstem of tamoxifen-treated DTA mice at 53 weeks p.i., but not in the cerebellum, cervical cord or corpus callosum, compared with control mice. N = 3 mice per genotype (brainstem, cervical cord and corpus callosum), n = 4 control mice and n = 3 DTA mice (cerebellum). P = 0.0262 between control and DTA mice in brainstem. No significance between control and DTA mice: cerebellum, P = 0.8691; cervical cord, P = 0.2245; corpus callosum, P = 0.1061. (d) Counts of the total axonal numbers showed significantly fewer axons in the cervical spinal cord ventrolateral white matter and the optic nerve areas of the tamoxifen-treated DTA mice 53 weeks p.i. as compared to control littermate mice. N = 3 mice per genotype. Between control and DTA mice: cervical cord, P = 0.0034; optic nerve, P = 0.0024. Data in c and d are presented as the mean + s.e.m. **P < 0.01, *P < 0.05 with two-tailed unpaired Student’s t test.

