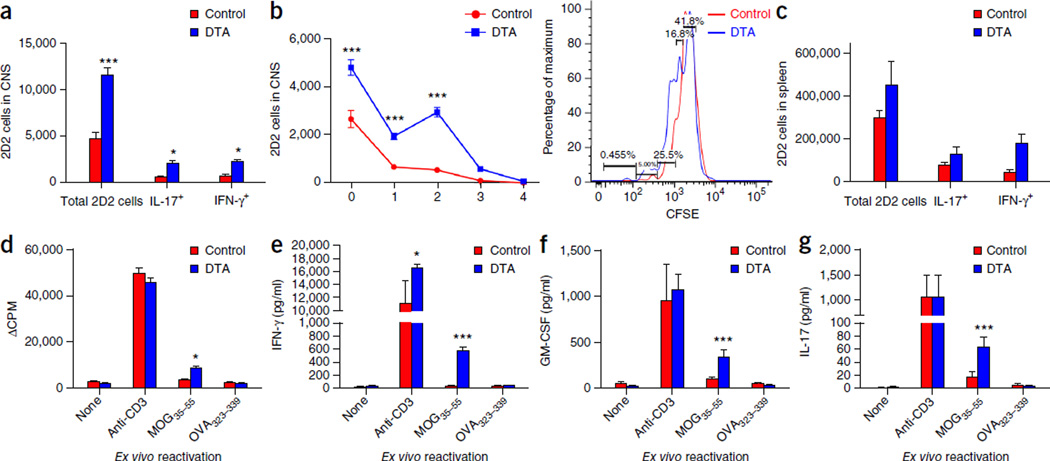
Figure 5.
Activated MOG-specific T cells infiltrate the CNS of the tamoxifen-treated DTA mice during the early demyelinating disease. (a–g) CFSE-labeled 2D2 (MOG-specific) T cells were adoptively transferred into tamoxifen-treated PLP-CreERT;ROSA26-eGFP-DTA mice at 7 weeks after injection and into control littermate (ROSA26-eGFP-DTA) mice. Flow cytometry was performed 1 week later; it showed increased numbers of proliferating CFSE-labeled 2D2 (MOG-specific) T cells in the CNS (P < 0.0001; one representative flow cytometry histogram is presented) (a,b), as well as in the spleens of the tamoxifen-treated DTA mice compared to control mice (c). Increased numbers of 2D2 cells producing proinflammatory cytokines (IL-17 (P = 0.0395) and IFN-γ (P = 0.0415)) were also detected in both the CNS (a) and the spleens (c) of the tamoxifen-treated DTA mice as compared to littermate (control) mice. Furthermore, splenocytes isolated from DTA mice showed increased cellular proliferation (d) (MOG35–55 activation, P = 0.0347), as well as secretion of the proinflammatory cytokines IFN-γ (anti-CD3 activation, P = 0.0234; MOG35–55 activation, P < 0.0001) (e), GM-CSF (MOG35–55 activation, P < 0.0001) (f) and IL-17 (MOG35–55 activation, P = 0.0003) (g) when the cells were activated ex vivo in the presence of MOG35–55. One representative experiment of two is presented with n = 5 mice per group. The data are presented as the mean + s.e.m. *P < 0.05 and ***P < 0.001 for differences shown between mice in different groups (n = 5); two-way ANOVA with Bonferroni post hoc analysis.

