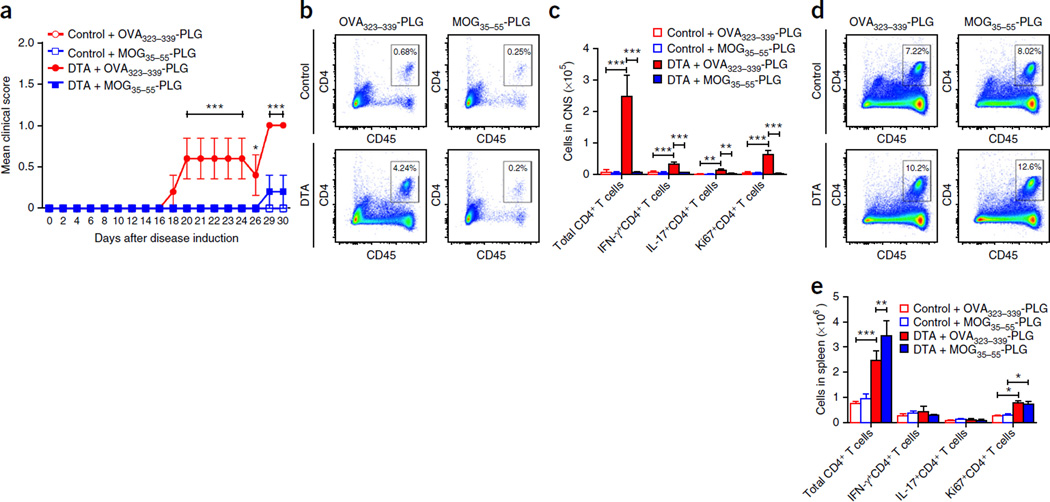
Figure 7.
MOG35–55-specific tolerance inhibits CNS entry of DTA mouse-derived MOG35–55-specific T cells. As in Figure 6, MOG35–55-activated blast cells were generated from tamoxifen-treated Plp1-CreERT;ROSA26-eGFP-DTA and control (ROSA26-eGFP-DTA) mice. Recipient Rag1−/− mice received control-derived or DTA-derived blast cells plus either OVA323–339-PLG or MOG35–55-PLG nanoparticles via i.v. injection (n = 5). (a) The recipient mice were followed for disease (DTA + MOG35–55-PLG compared to DTA + OVA323–339-PLG: P < 0.0001, days 20–24 and days 29–30; P = 0.0331, day 26) and, on day 30 after cell transfer, spleen and CNS samples were assayed for the number and phenotype of the CD4+ T cells present. (b) Analysis of representative CNS samples gating on total singlet live CD45hiCD4+ cells. (c) This population of CD4+ T cells was further analyzed to determine the number of T cells that were CD4+ (control + OVA323–339-PLG compared to DTA + OVA323–339-PLG, P < 0.0001; DTA + OVA323–339-PLG compared to DTA + OVA323–339-PLG, P < 0.0001), IFN-γ+CD4+ (control + OVA323–339-PLG compared to DTA + OVA323–339-PLG, P < 0.0001; DTA + OVA323–339-PLG compared to DTA + OVA323–339-PLG, P < 0.0001), IL-17+CD4+ (control + OVA323–339-PLG compared to DTA + OVA323–339-PLG, P ≤ 0.0032; DTA + OVA323–339-PLG compared to DTA + OVA323–339-PLG, P = 0.0032), and Ki67+CD4+ (control + OVA323–339-PLG compared to DTA + OVA323–339-PLG, P < 0.0001; DTA + OVA323–339-PLG compared to DTA + OVA323–339-PLG, P < 0.0001). Representative flow plots are presented in Supplementary Figure 8a–c. (d) Analysis of representative spleen samples gating on total singlet live CD45hiCD4+ cells. (e) This population of CD4+ T cells was further analyzed to determine the number of T cells that were CD4+ (control + OVA323–339-PLG compared to DTA + OVA323–339-PLG, P < 0.0001; DTA + OVA323–339-PLG compared to DTA + OVA323–339-PLG, P = 0.0099), IFN-γ+CD4+, IL-17+CD4+, and Ki67+CD4+ (control + OVA323–339-PLG compared to DTA + OVA323–339-PLG, P = 0.02; DTA + OVA323–339-PLG compared to DTA + OVA323–339-PLG, P = 0.009). One representative experiment of two is presented with n = 5 mice per group. Representative flow plots are presented in Supplementary Figure 8d–f. The data are presented as mean + s.e.m. *P < 0.05, **P < 0.01 and ***P < 0.001 for differences shown between mice in different groups; two-way ANOVA with Bonferroni post hoc analysis.

