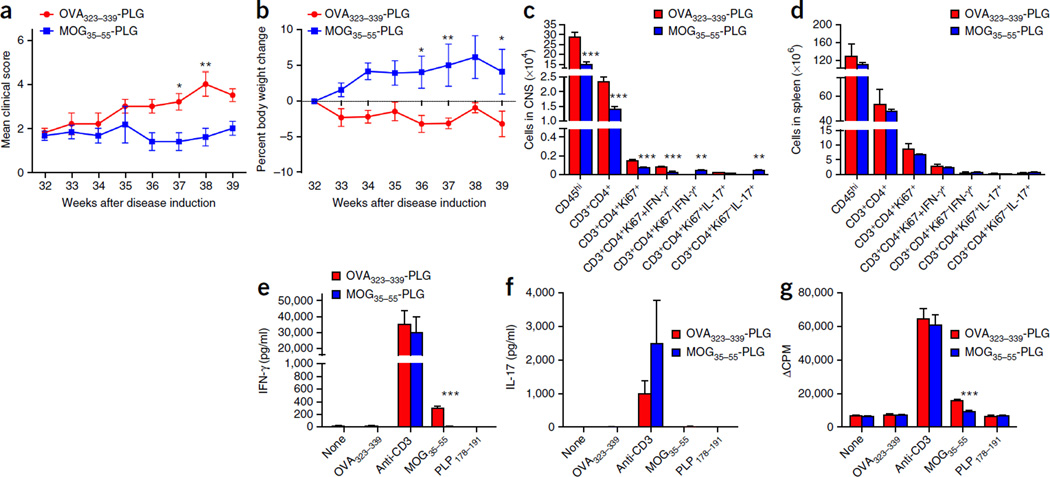
Figure 8.
Tolerance against MOG35–55 inhibits neurological disease induced by the DTA-derived MOG-specific T cells. Tamoxifen-treated Plp1-CreERT;ROSA26-eGFP-DTA mice at 32 weeks after injection were either tolerized against the MOG35–55 peptide by a single i.v. treatment with MOG35–55-PLG nanoparticles or injected with control OVA323–339-PLG nanoparticles. (a) Motor defects (DTA + OVA323–339-PLG compared to DTA + MOG35–55-PLG: week 37, P = 0.0393; week 38, P = 0.0019) and (b) weight loss were assessed weekly between weeks 32 and 39 (DTA + OVA323–339-PLG compared to DTA + MOG35–55-PLG: week 36, P = 0.0281; week 37, P = 0.009; week 39, P = 0.0434). (c,d) At week 39 after injection, FACS analysis of the CNS (c) (CD45hi, P < 0.0001; CD3+CD4+, P < 0.0001; CD3+CD4+Ki67+, P < 0.0001; CD3+CD4+Ki67+IFN-γ+, P < 0.0001; CD3+CD4+Ki67−IFN-γ+, P = 0.009; CD3+CD4+Ki67−IL-17+, P = 0.009) and spleens (d) was completed to determine the number and phenotype of the CD4+ T cells in these tissues. (e–g) CD4+ T cell responses to MOG35–55 were assessed by culturing 1 × 10⁶ total splenocytes for 3 d with medium alone, anti-CD3 (1 µg/ml), OVA323–339, MOG35–55 or PLP178–191 (10 µg/ml). The levels of secreted IFN-γ (e) (MOG35–55 activation P < 0.0001), IL-17 (f) and cellular proliferation (g) (MOG35–55 activation P < 0.0001) as determined by tritiated thymidine incorporation were assessed. One representative experiment of two is presented with n = 6 mice per group. The data are presented as the mean + s.e.m. *P < 0.05, **P < 0.01 and ***P < 0.001 for differences shown between the different groups. Two-way ANOVA with Bonferroni post hoc analysis.

