Figure 1.
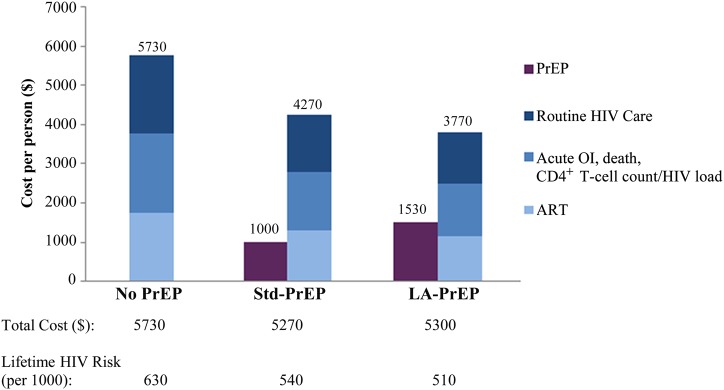
Average discounted per-person lifetime cost distribution of the no preexposure prophylaxis (PrEP), standard PrEP (Std-PrEP), and long-acting PrEP (LA-PrEP) strategies. Discounted per-person lifetime costs (in 2014 $) are provided on the vertical axis. Costs associated with PrEP administration (drug costs, safety labs, and clinic visits) are shown in dark purple. Costs associated with human immunodeficiency virus (HIV) care are blue. Antiretroviral therapy (ART) costs are lightest blue. HIV routine care costs, such as clinic visits, are dark blue. Costs associated with laboratory monitoring and AIDS-defining events for HIV-infected people are medium blue. Total costs (sum of overall PrEP costs and overall HIV costs), as well as lifetime risk of HIV infection associated with each strategy, are in the rows below the figure. These values demonstrate the interaction between the PrEP investment and its prevention impact. Investments in PrEP programs resulted in lower HIV-related costs and substantially fewer HIV infections. Abbreviation: OI, opportunistic infection.

