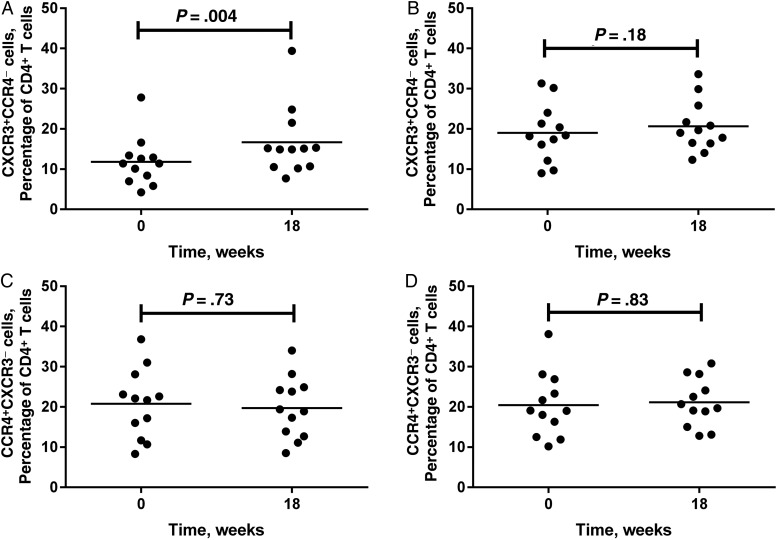
Figure 2.
Frequencies of T-helper type 1 (Th1) and Th2 cells in peripheral blood prior to and following KEX1 and mock immunizations. To evaluate skewing of the T-helper cell phenotype, peripheral blood lymphocytes were analyzed by flow cytometry for surface markers associated with either Th1 (CXCR3+CCR4−) or Th2 (CCR4+CXCR3−) CD4+ cells and expressed as a percentage of total peripheral blood CD4+ T cells. Comparisons were made between data before immunization and data 18 weeks following initial immunization (6 weeks after boost). Frequencies of T-helper populations for KEX1-immunized animals are given in panels A and C; frequencies of T-helper populations for mock-immunized animals are given in panels B and D.

