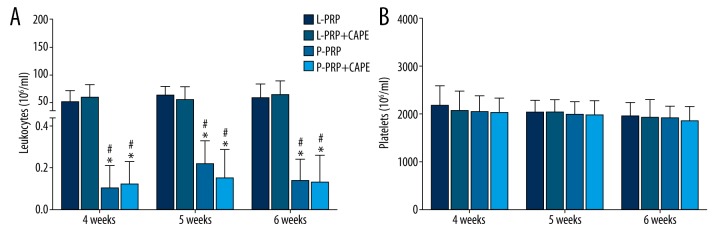
Figure 2.
Leukocyte and platelet concentrations in platelet-rich plasma formulations used in the study. (A) At each time point, the leukocyte concentrations in leukocyte- and platelet-rich plasma (L-PRP) used in the L-PRP group and L-PRP+ caffeic acid phenethyl ester (CAPE) group were higher than in pure platelet-rich plasma (P-PRP), which was used in the P-PRP group and P-PRP+CAPE group. (B) L-PRP and P-PRP were similar in platelet concentrations. Boxes and error bars represent mean ± standard deviation (n=10); * p<0.05 compared with L-PRP used in the L-PRP group at the same time point; # p<0.05 compared with L-PRP used in the L-PRP+CAPE group at the same time point.

