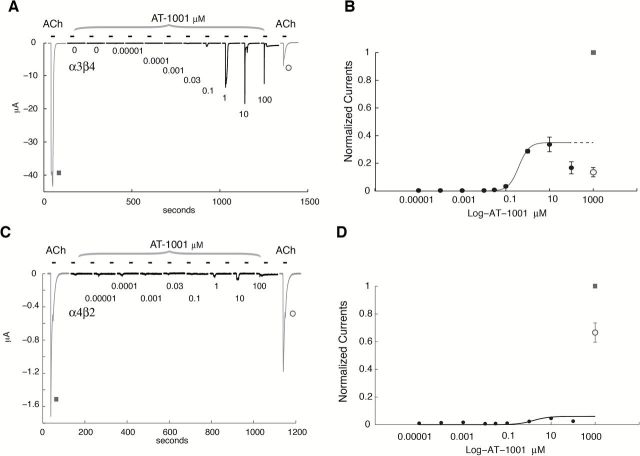
Figure 1.
Activation of human α3β4 and α4β2 nicotinic acetylcholine receptor (nAChR) expressed in Xenopus oocytes by AT-1001. (A and C) Typical currents recorded in oocytes expressing the human α3β4 and α4β2 nAChR in response to brief pulses of acetylcholine (ACh) and AT-1001. Oocytes were challenged at 2-min intervals with increasing concentrations of AT-1001 (0.01nM, 0.1nM, 1nM, 30nM, 0.1 μM, 1 μM, 10 μM, and 100 μM) for 5 s. A reference ACh pulse (1,000 μM, 5 s) was applied at the beginning (black square) and at the end (open circle) of each experiment to evaluate the maximal response of the cell to ACh and to normalize the evoked currents. Data were normalized to unity versus the first ACh-evoked response. (B and D) Dose-response concentration activation curves showing a plot of the peak inward current as a function of the logarithm of AT-1001 concentration (n = 4 for α3β4 and n = 4 for α4β2). Filled square indicates the ACh response normalized to unity, whereas the empty circle indicates the amplitude of the ACh-evoked current observed after compound exposure. The differences in fraction of ACh-evoked currents observed between the two receptor subtypes could be due to differences in receptor expression. A continuous line through the datapoints is the best fit obtained with the Hill equation, yielding an EC50 of 0.37±0.1 μM and a Hill coefficient of 2.1±0.29 with a scaling factor of 0.35±0.05 (n = 4) for α3β4 nAChR. Results obtained at α4β2 yielded an EC50 of 1.5±0.2 μM, a Hill coefficient of 1.26±0.03 with a scaling factor of 0.06 (n = 3).

