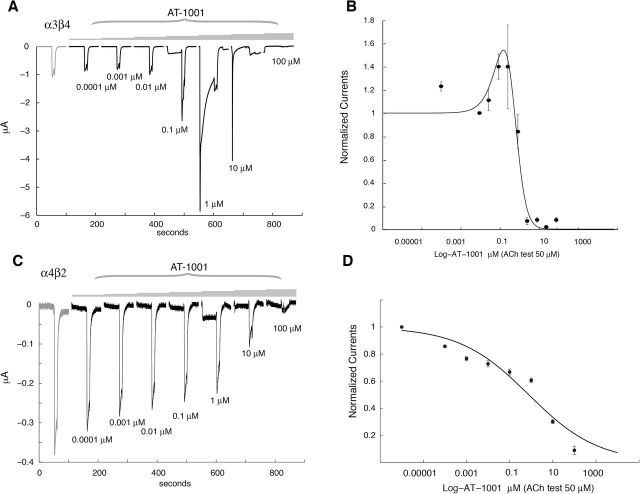
Figure 3.
Effect of sustained exposure to AT-1001 at the human α3β4 and α4β2 nicotinic acetylcholine receptors (nAChRs). (A and C) Current evoked by 50-μM acetylcholine (ACh) test pulses recorded in absence (gray line) or presence of AT-1001 at different concentrations using an experimental protocol that results in a sustained exposure to AT-1001. In this protocol, the cell is first exposed for 45 s to a steady concentration of AT-1001 (0.0001 μM, 0.001 μM, 0.01 μM, 0.1 μM, 1 μM, 10 μM, and 100 μM) and the response evoked by a brief ACh test pulse (50 μM, 10 s) is recorded in presence of the same concentration of compound. ACh and compound are rinsed for 15 s before returning into the same concentration of AT-1001. (A) Note the marked activation of the receptors caused by pre-application of AT-1001 as low as 0.1 μM and current increase observed at 1 μM. (C) Note the small but significant activation of the α4β2 receptors caused by pre-application of AT-1001 at 1 μM and the progressive decline of the ACh responses as a function of the AT-1001 concentration. (B and D) Plot of the peak current evoked by ACh as a function of the concentration of AT-1001 (n = 5–12 for α3β4 and n = 4 for α4β2). (B) The continuous line through the datapoints is the best fit obtained with a two-site equation for α3β4 with f = 0.77, ACh = 50 μM, KA = 225 μM, IC50 = 0.61 μM, and KB = 0.5 μM. (D) Continuous line through the datapoints is the best fit obtained with a Hill equation for α4β2 with an IC50 = 0.77±0.27 μM and nH = 0.27±0.01.

