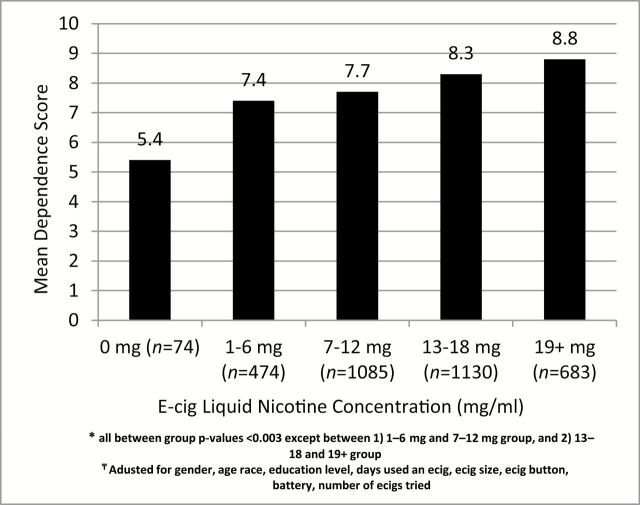
Figure 2.
Adjusteda Penn State Electronic Cigarette Dependence Index by e-cig nicotine concentration* (n = 3,446). aAdjusted for gender, age, race, education level, days used an e-cig, e-cig size, e-cig button, battery, and number of e-cig. *All between group p values <.003 except between (1) 1–6-mg and 7–12-mg group, and (2) 13–18 and 19+ group.

