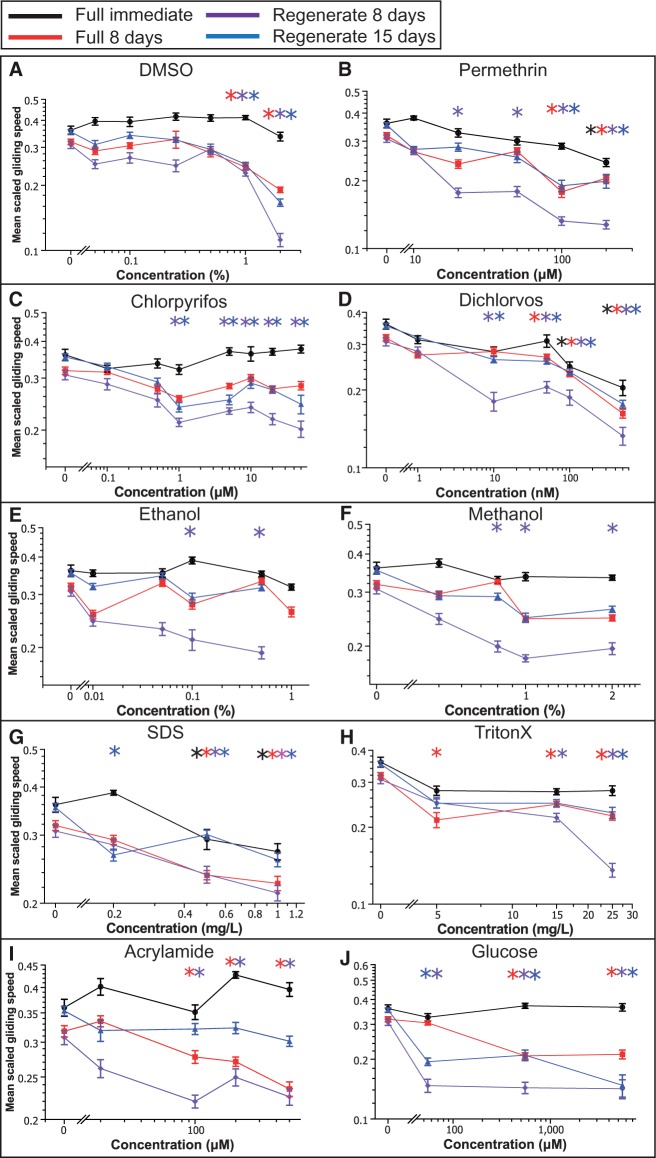
FIG. 3.
Unstimulated behavior of toxicant-exposed full and regenerating worms. Semi-log plot of mean scaled gliding speeds as a function of concentration during exposure to: A, DMSO, B, permethrin, C, chlorpyrifos, D, dichlorvos, E, ethanol, F, methanol, G, SDS, H, TritonX-100, I, acrylamide, and J, glucose. Different graphs correspond to the different time points and situations tested: immediate reaction of full worms, 8 days reaction of full worms and reaction of regenerating worms at both 8 and 15 days. Errors bars are SE of populations of n = 24 worms. Stars indicate statistical relevance at the 1% level for the corresponding time point when compared with control worms.

