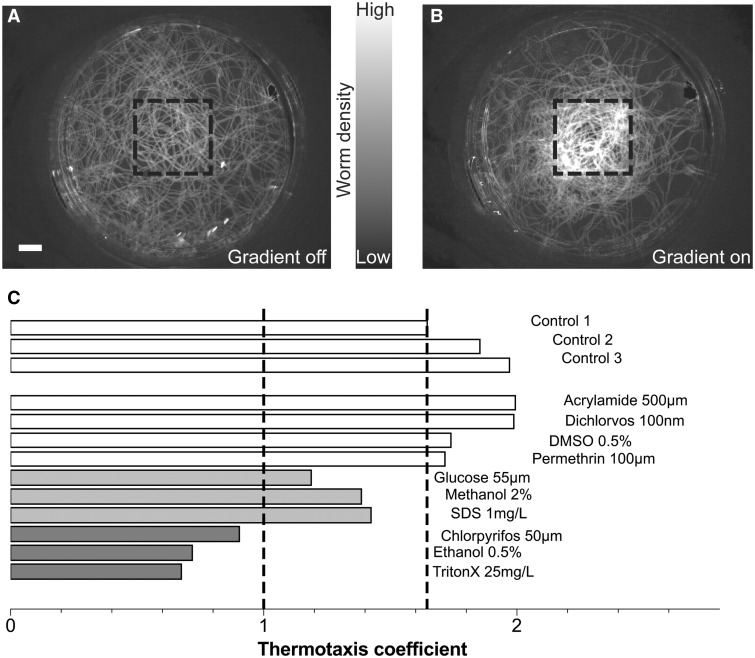
FIG. 6.
Temperature sensing assay. A, Wild-type worms (n = 20) density heatmap over a 10-min course in the absence or B, presence of a thermal gradient. Black dotted line shows the area of the cold spot in the center of the dish and gray levels indicate higher worm density in that region in presence of the gradient. Scale bar: 1 cm. C, Thermotaxis coefficient for worm populations (n = 20 for each) exposed to different toxicants. The black dotted lines indicate the level of absence of any reaction (thermotaxis coefficient of 1) and the lowest measurement of 3 control populations. The different conditions are further classified based on these 2 cutoffs as normal thermotaxis (white bars), impaired thermotaxis (light gray bars) and no thermotaxis (dark gray bars).

