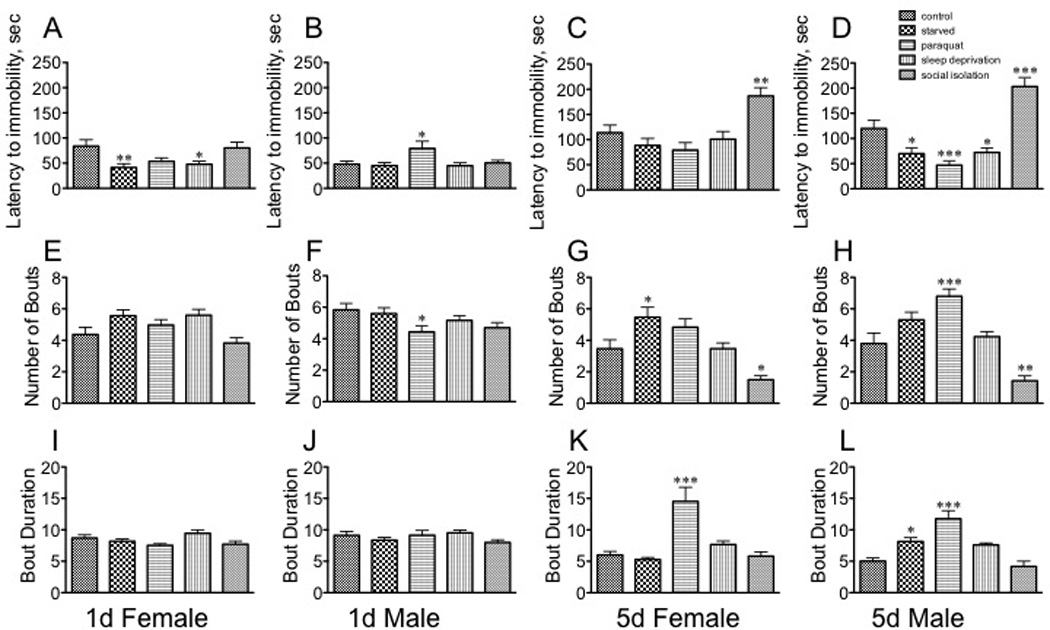
Fig. 5. The effect of stressors on behavioral parameters of the Forced Swim Test.

A – D, latency to first bout of immobility; E – H, number of bouts; I – L, bout duration. A, E, I sexually immature females; B, F, J sexually immature males; C, G, K sexually mature females; D, H, L, sexually mature males. Statistical comparisons between control and stress conditions within a population, * p < 0.05, ** p < 0.01, *** p < 0.001, one-way ANOVA followed by Dunnet’s post test. n = 30 for each population.
