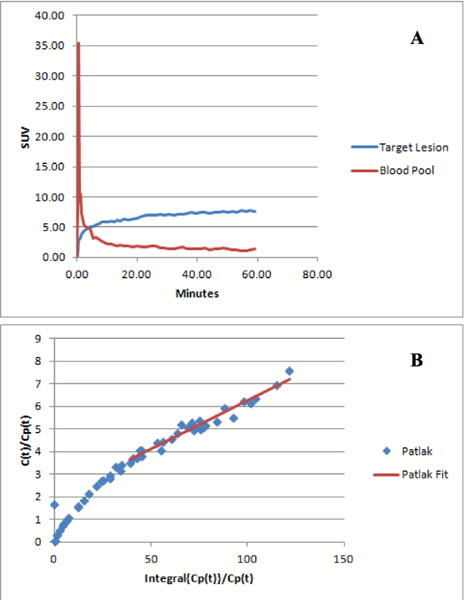
Figure 5.

Figure A shows the 18FLT Time–activity-curve representing the average of all tumor target lesions, in which uptake is expressed in SUVest.max. Lymphoma showed rapid uptake of 18FLT, peaking at approximately 5 to 10, followed by relative plateau. Figure B shows the Patlak graphical analysis plot. Note the linearity consistent with irreversible binding.
