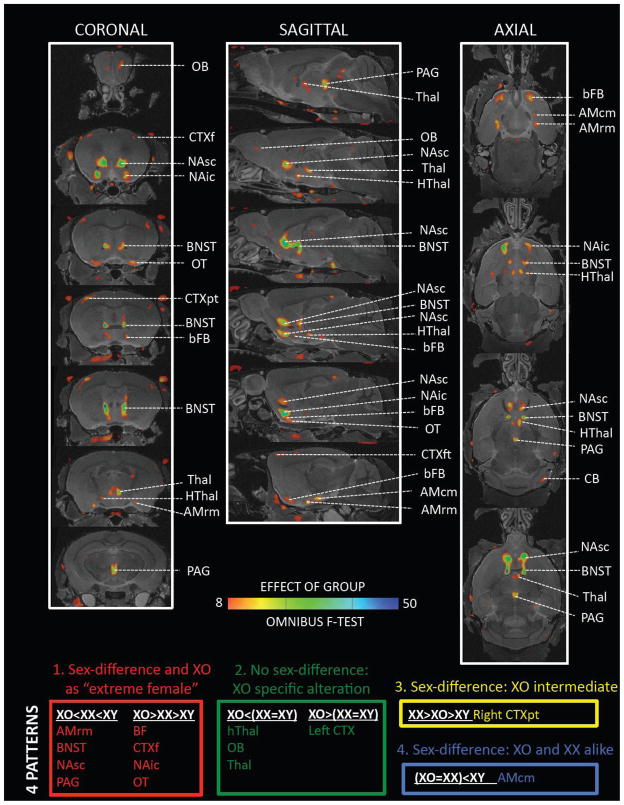
Figure 3. Coronal, Sagittal and Axial Maps Showing Regions Of Significant Anatomical Variation Across XO, XX and XY Mice, With Grouping of These Regions According to Pattern of Pairwise Group Differences.
Color-maps encode a FDR-thresholded F-statistic for the omnibus effect of group. The color-coding for each of the four observed patterns relates to the plots shown in Figure 4 Abbreviations: AMcm – caudomedial amygdala, AMrm – rostromedial amygdala, bFB – basal forebrain, BNST – bed nucleus of the stria terminalis, CB – cerebellum, CTX – cortex (f –frontal, p-parietal), HThal – hypothalamus, NAic – infracommisural nucleus accumbens, NAsc – supracommisural nucleus accumbens, OB – olfactory bulb, OT – olfactory tubercle, PAG – periaqueductal gray, Thal – thalamus.

