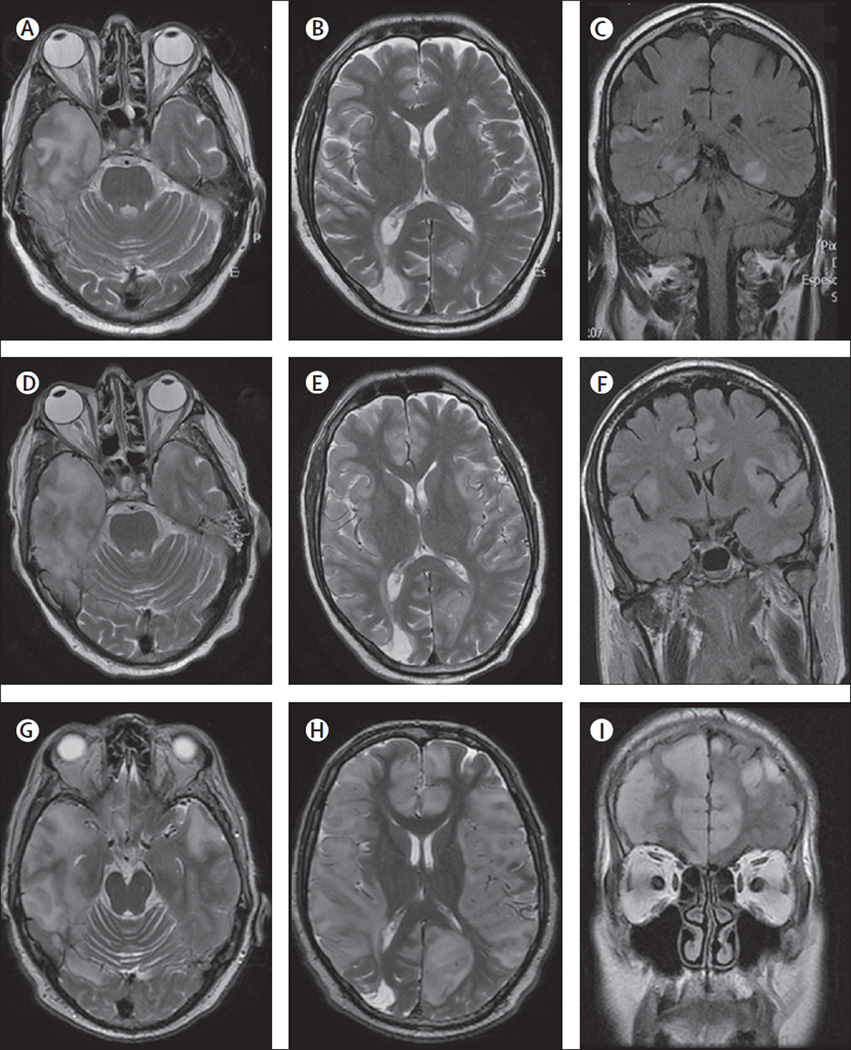
Figure 5. MRI findings in index patient 2.
On day 2 of admission, the MRI of this patient showed multiple areas of FLAIR and T2 signal abnormality predominantly involving cortical regions (A–C), without oedema, mass effect, or contrast enhancement (data not shown), but with blurring of the grey-white matter junction. On day 14, repeated MRI showed interval increase of the cortical-subcortical involvement, with oedema in the right temporal lobe (D–F). Subsequent MRIs showed a pronounced worsening of these abnormalities now extensively involving cortical and subcortical regions (G–I).

