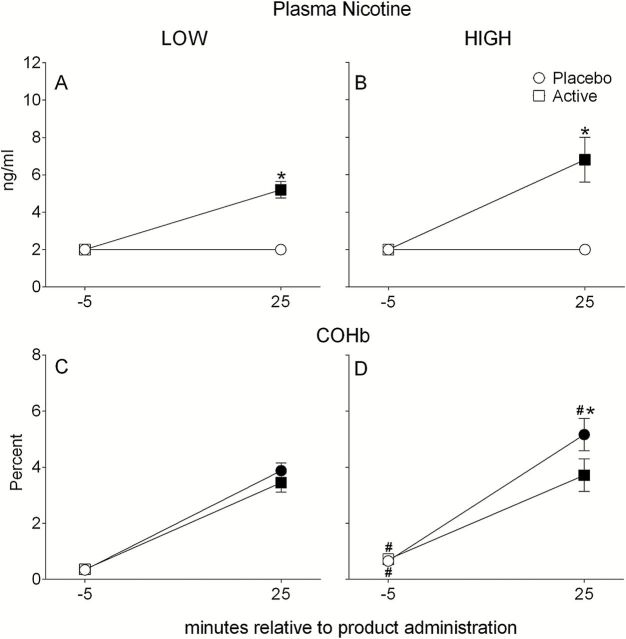
Figure 1.
Mean ± SEM by waterpipe use frequency group (LOW, HIGH) for plasma nicotine (panel A, n = 60; panel B, n = 16) and COHb (panel C, n = 63; panel D, n = 17) for the placebo and active conditions. Filled symbols indicate a significant difference relative to −5min; asterisks (*) indicate a significant difference between placebo and active conditions at that time point within frequency group; number signs (#) indicate a significant difference between LOW and HIGH users at that time point and same condition (ps < .05).

