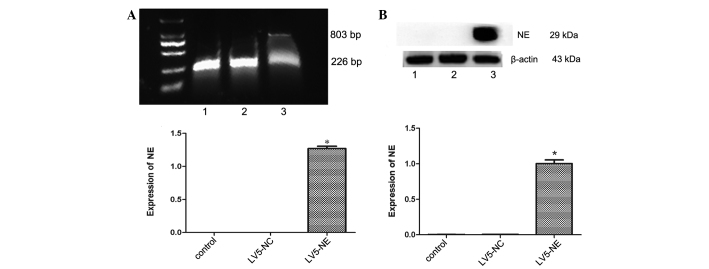
Figure 3.
Effects of transfection with LV5-NC or LV5-NE on NE expression in NB4 cells. (A) The mRNA expression of NE was assessed by reverse-transcription semi-quantitative PCR analysis. The upper panel shows an electrophoretic gel containing the PCR products, which were quantified by densitometry (lower panel). The mRNA of NE was expressed in LV5-NE-transfected NB4 cells, but not in untreated or LV5-NC-transfected cells. The 803 bp band was mRNA of NE and 226 bp was mRNA of glyceraldehyde 3-phosphate dehydrogenase. (B) The protein expression of NE was assessed by western blot analysis. The upper panel shows a representative blot, and quantitative analysis of protein levels was performed by densitometric analysis. The NE protein was highly expressed in LV5-NE-transfected NB4 cells, while expression was low in untreated or LV5-NC-transfected cells. Lanes: M, marker; 1, NB4 cells; 2, NB4 cells transfected with LV5-NCs; 3, NB4 cells transfected with LV5-NE. Values are expressed as the mean ± standard deviation. *P<0.05 vs. control/LV5-NC groups. LV5-NC, negative control vector; LV5-NE, lentiviral vector overexpressing neutrophil elastase; PCR, polymerase chain reaction.

