
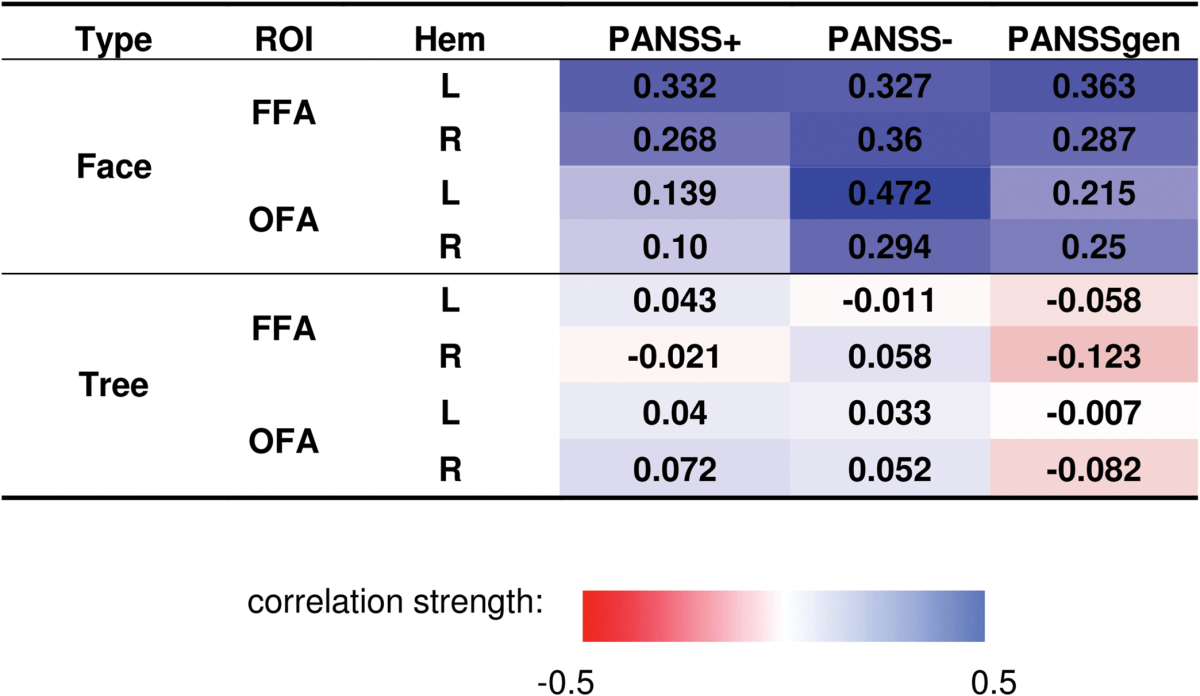
Table 2.
Correlation Coefficients (P Value in Parentheses) Between BOLD Responses and Psychotic Symptomology
|
Note: The BOLD responses are averaged across stimulus contrasts. The symptoms are measured by PANSS.51 The color scale indicates the strength of the correlation coefficient. The top 2 sections are for BOLD responses to faces and trees, respectively. The bottom section is for face-selectivity index (differences in BOLD response to faces and to trees). BOLD, blood oxygen level dependent; ROI, region of interest; PANSS, Positive and Negative Syndrome Scale; FFA, fusiform face; OFA, occipital face area.