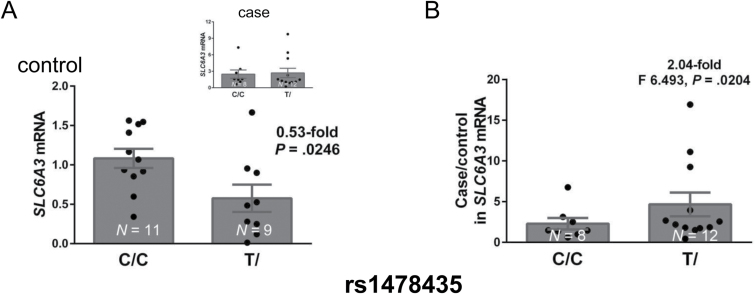
Fig. 2.
Correlation of rs1478435 genotypes with mRNA levels in dopamine (DA) neurons. (A) Reduced mRNA expression levels in rs1478435 T-carrying controls. Insert, no genotypic difference in cases. Regression analysis showed a significant phenotype difference (P = .0062, with no interaction between genotype and phenotype). (B) Case/control ratio in expression levels increased in rs1478435 T-carriers. mRNA levels were normalized by actb mRNA levels; *P < .05; **P < .01 by Student’s t tests (N = 20 for each phenotype).

