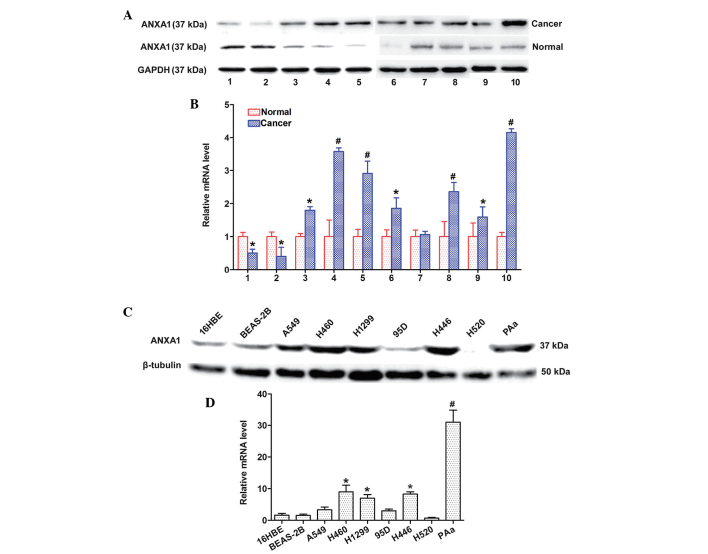
Figure 1.
Relative expression levels of annexin A1 (ANXA1) in non-small cell lung cancer (NSCLC) tissues and cell lines. (A) Western blotting indicated that ANXA1 expression was markedly increased in NSCLC tissues. *P<0.05, #P<0.01 vs. normal lung tissues. (B) Quantitative polymerase chain reaction analysis indicated that the mRNA expression levels of ANXA1 were upregulated in NSCLC tissues. (C) ANXA1 protein expression levels were increased in NSCLC cell lines. (D) ANXA1 mRNA expression levels were downregulated in the normal cell line. Glyceraldehyde 3-phosphate dehydrogenase (GAPDH) and β-tubulin were used as endogenous controls. Data are presented as the mean ± standard deviation for triplicate determinations. *P<0.05, #P<0.01 vs. 16HBE cells.

