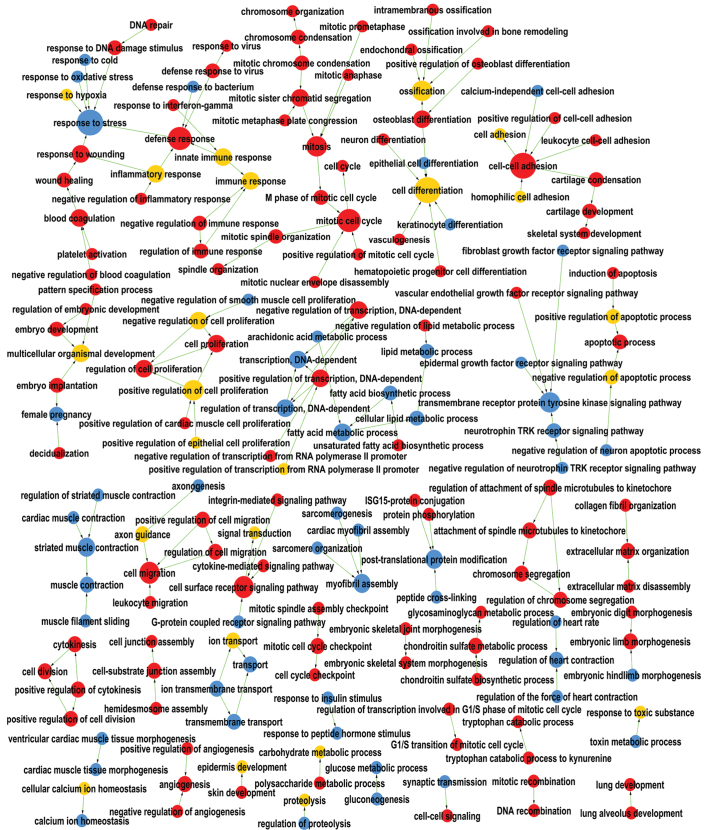
Figure 2.
Gene ontology map for head and neck squamous cell carcinomas. Circles represent genetic functions of differentially expressed genes, with their size being proportional to the importance of their function. Red represents functions encoded by upregulated genes, blue represents functions encoded by downregulated genes and yellow represents functions encoded by up- as well as downregulated genes. Straight lines represent links between genetic functions.

