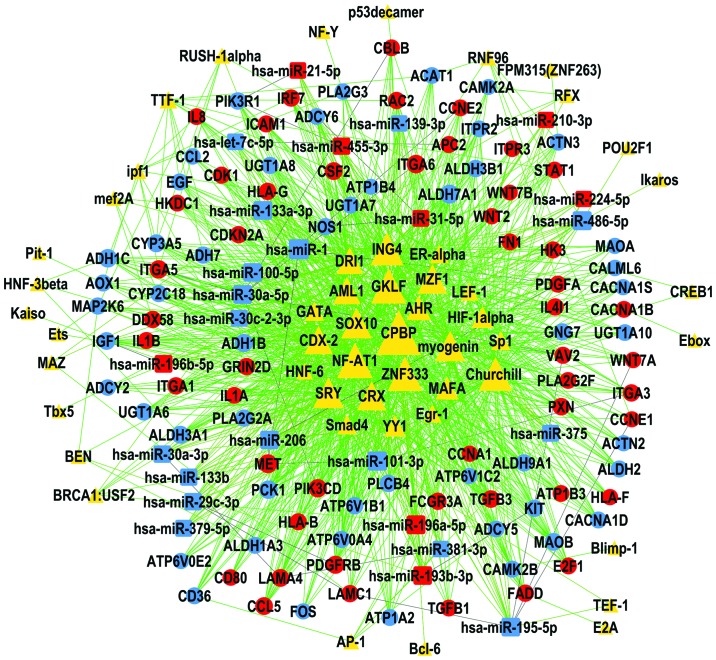
Figure 4.
TF - miRNA - gene regulation network in head and neck squamous cell carcinomas. Triangles represent TFs, circles represent differentially expressed genes and rounded rectangles represent differentially expressed miRNAs, with their area being relative to the significance. Red represents upregulation, blue represents downregulation and yellow represents up- as well as downregulation. Straight lines represent regulatory interactions. TF, transcription factor; miR, microRNA.

