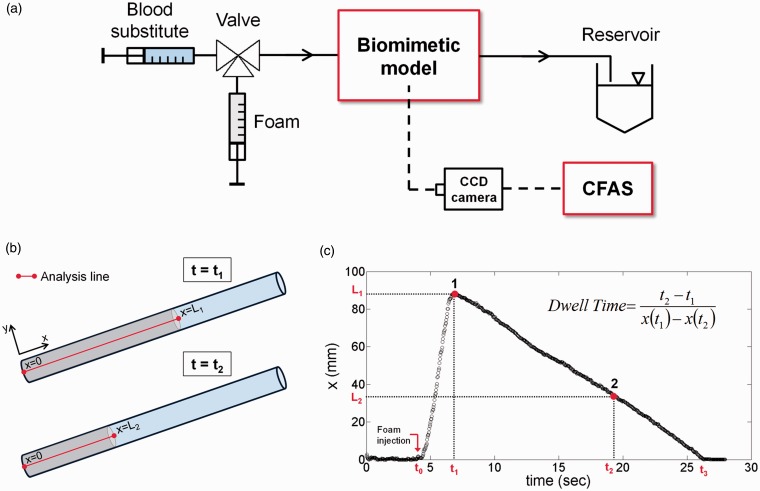
Figure 3.
Schematic of the biomimetic vein model set-up (a). Foam is injected into the tube over time t1 to form a column of length x (mm) (b). On completion of the injection at x = L1, the foam degrades over time t2 to a length of x = L2, whereby the DR and DT may be attained (c).
CFAS: computational foam analysis system.

