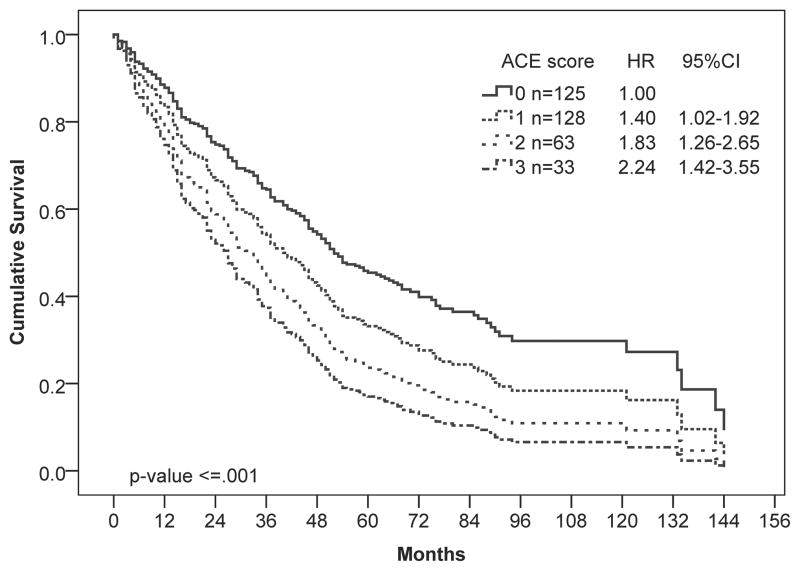
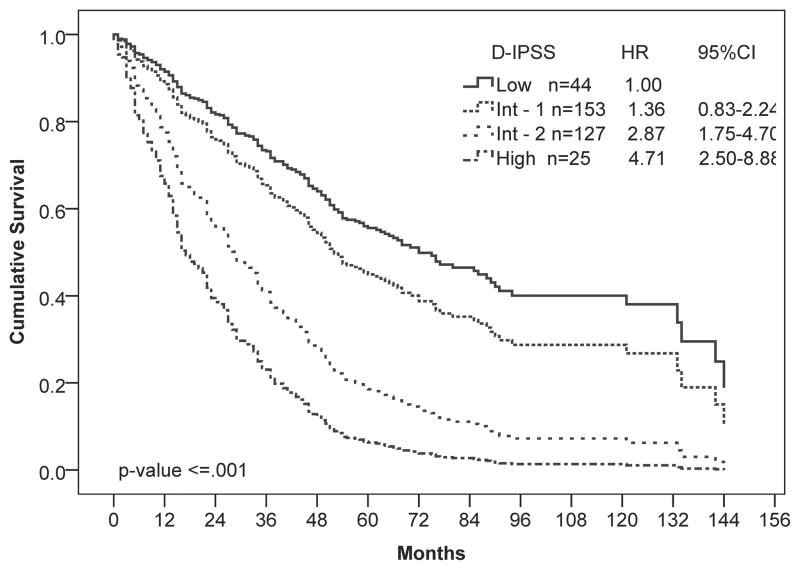
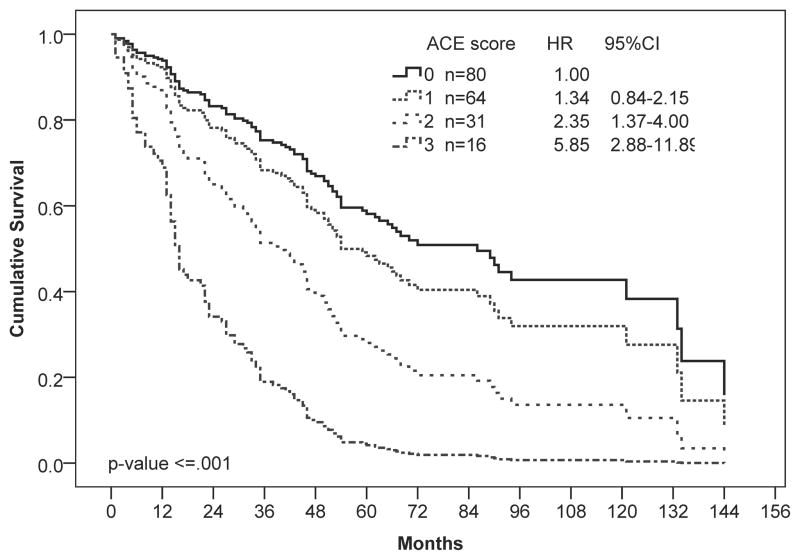
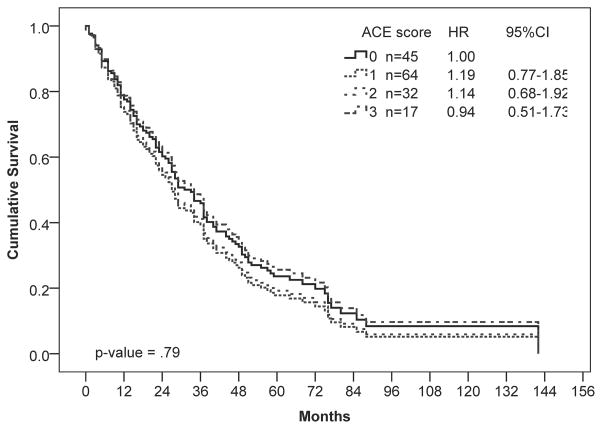
Figure 1.
Univariate Cox regression analysis of overall survival by (A) ACE-27, (B) D-IPSS, and (C, D) ACE-27 stratified by age: (C) 65 years and younger and (D) older than 65 years. Hazard ratios (HR) and 95% confidence intervals (CI) were calculated using Cox-proportional hazards regression. Number of patients in each risk category and Hazard ratios (HR) with 95% confidence intervals (CI) are shown.


