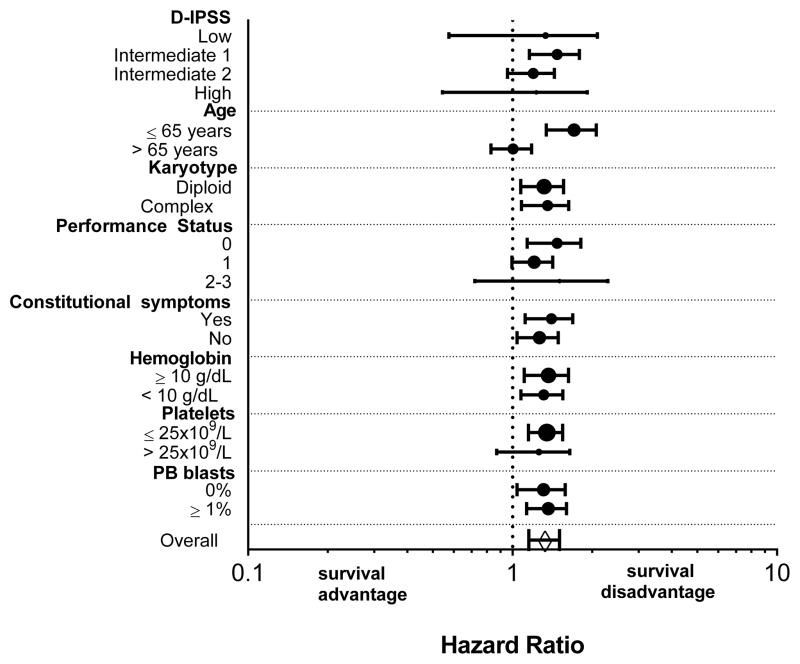
Figure 2.
Univariate analysis of association of ACE-27 score with survival by demographic and clinical characteristics. Circles represent the Hazard ratio and 95% confidence intervals are shown. The size of the circles are proportional to the number of patients in each subgroup. The diamond shows the Hazard ratio for the whole patient population.

