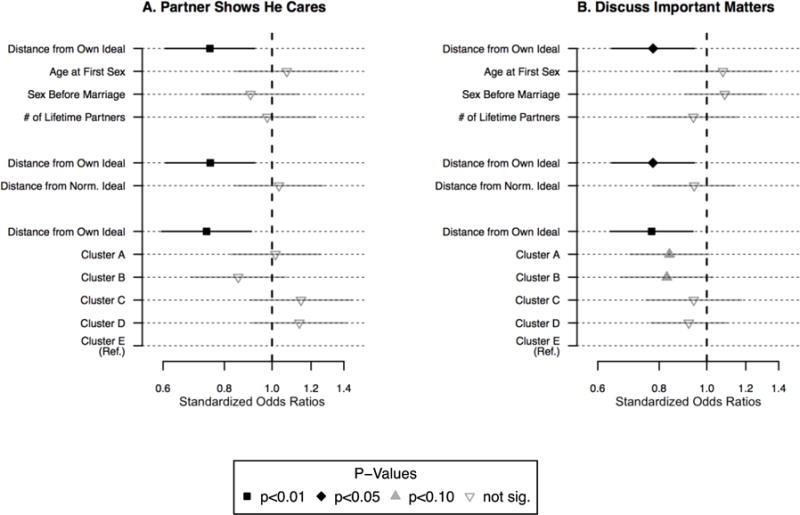
Figure 4.

Comparison of Standardized Odds Ratios for Logistic Regression Models Predicting Relationship Quality Measures.
Note: Horizontal lines depict the 95% confidence intervals around each point. The x-axis is logged to accommodate the visual comparison of ratio values. For full results, see Tables S2 through S5 in the online supplement.
