
Figure 3. Recruitment and phosphorylation of cSH2 cannot be accomplished by the same kinase in cis.
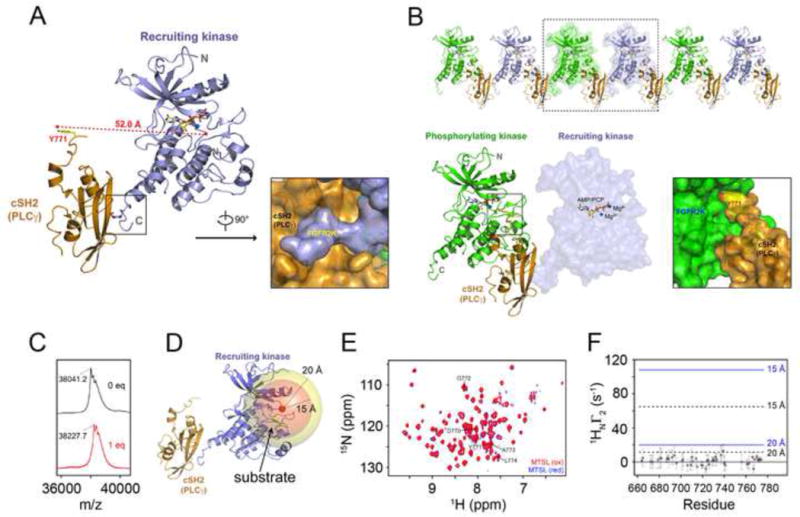
(A) Ribbon diagram of the crystal structure of the complex between mutationally-activated monophosphorylated FGFR2KpY769 in complex with PLCγ cSH2 domain. Surface representation showing insertion of phosphorylated C-terminal tail of recruiting kinase into the phosphotyrosine binding pocket of the PLCγ cSH2 domain. (B) 2:1 FGFR2 kinase-PLCγ cSH2 complex is observed in the crystal lattice. Surface representation showing insertion of Tyr-771 phosphorylation site from the PLCγ cSH2 domain into the active site of the phosphorylating kinase. The phosphorylating kinase and the recruiting kinase are colored green and lightblue, respectively. The PLCγ cSH2 domain is colored orange. The ATP analogue (AMP-PCP) and magnesium ions are rendered as sticks and blue spheres, respectively. (C) MALDI-TOF results of MTSL labeling of Cys-491 in the glycine-rich loop of FGFR2KpY769 (FGFR2K-pY769MTSL). The observed mass/charge difference upon labeling with MTSL was 186.5, which agrees closely with the expected value of 186.3. (D) Crystal structure of recruiting FGFR2K-pY769 bound to cSH2 showing the Cβ of Cys-491 (red sphere) and two spheres of 15 Å and 20 Å surrounding this site. A bound substrate tyrosine in the catalytic pocket, shown in green color stick, would be expected to lie within the 15 Å sphere. (E) 1H/15N TROSY spectra of 1:1 samples of cSH2:FGFR2K-pY769MTSL before (intact MTSL; red) and after treatment with ascorbic acid (reduced MTSL; blue). The cSH2 samples were 70% deuterated. (F) 1H relaxation enhancement (Γ2) due to the presence of the MTSL spin label probed using a two-point TROSY method where the difference in the relaxation delays were 10 msec (Iwahara et al., 2007). Y771 is shown as a red circle. Distances of 15 Å and 20 Å between the spin label and amide proton are shown on the plot using correlation times of 15 nsec (black, dotted line) and 25 nsec (blue, solid line). A Γ2 value close to zero indicates a distance > ~25 Å from the spin label. Based on the crystal structures of FGFR kinases-substrate complexes, the distance between the tyrosine to be phosphorylated and adjacent residues ranges from ~10 to 13 Å. See also Figures S3, S4, S5 and S8.