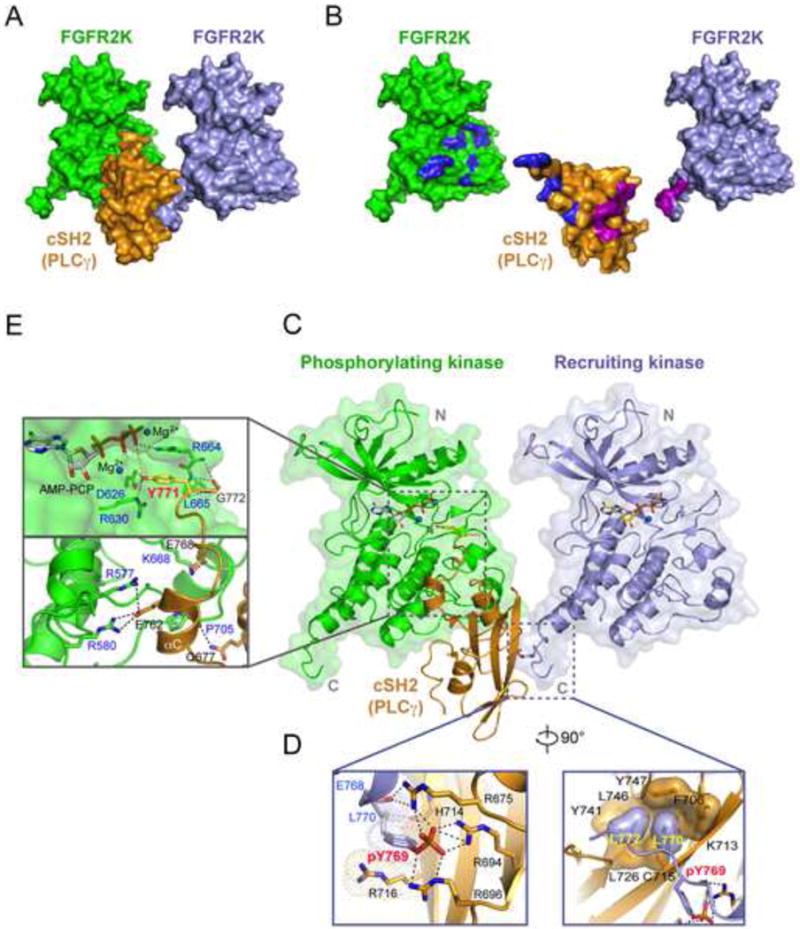
Figure 4. Crystal structure of 2:1 FGFR2 kinase-PLCγ cSH2 complex.

(A) Whole view of the 2:1 FGFR2 kinase-PLCγ cSH2 complex. (B) The binding interfaces between the cSH2 domain and the recruiting kinase are colored magenta and those between the cSH2 domain and the phosphorylating kinase are colored blue. (C) The phosphotyrosine binding pocket of the PLCγ cSH2 domain (in orange) is engaged by the phosphorylated tyrosine (pTyr-769) at the C-terminal tail of the recruiting kinase (in lightblue) while Tyr-771 of PLCγ is docked into the active site of the phosphorylating kinase (in green). (D) Close-up views of the interactions between the recruiting kinase and the cSH2 domain. (E) Close-up views of the interactions between the phosphorylating kinase and the PLCγ cSH2 domain. In panel D and E, side chains of key interacting residues are shown as sticks. Hydrogen bonds are shown as dashed lines. Oxygen atoms are colored red and nitrogen atoms are colored blue. The ATP analogue (AMP-PCP) and magnesium ions are rendered as sticks and blue spheres, respectively. See also Figures S4, S6, S8 and S9.
