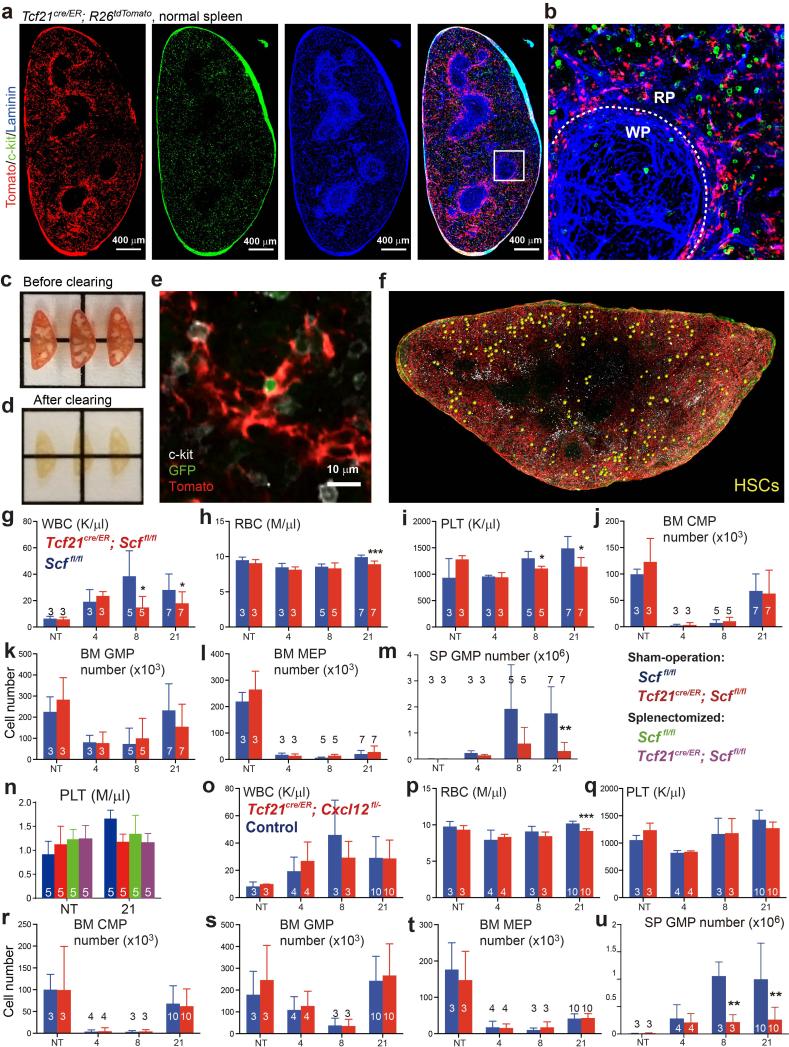
Extended Data Figure 3. Deep imaging of HSCs in the spleen; deletion of Scf or Cxcl12 from Tcf21-expressing stromal cells in the spleen reduced peripheral blood cell counts but did not affect bone marrow haematopoiesis.
a, b, The vast majority of c-kit+ haematopoietic progenitors localized adjacent to Tcf21-expressing stromal cells in the red pulp of the normal spleen (n=3 mice from 3 independent experiments). c, d, 300 μm thick sections of spleen before (c) and after optical clearing (d). e, f, Deep imaging of α-catulin-GFP+c-kit+ HSCs in cleared spleen segments from Tcf21cre/ER; R26tdTomato; α-catulin mice. A representative high magnification image of an α-catulin-GFP+c-kit+ HSC surrounded by Tomato+ stromal cells (e). f, Low magnification view of a digitally reconstructed 300 μm thick spleen fragment with α-Catulin-GFP+c-kit+ HSCs identified by large yellow spheres. Note that actual HSCs would be smaller than the yellow spheres but would not be visible at this magnification (n=3 mice from 3 independent experiments). g-m, Tcf21cre/ER; Scffl/fl and Scffl/fl control mice were treated with tamoxifen then examined a month later without further treatment (not treated, NT) or after treatment with cyclophosphamide plus 4, 8, or 21 days of G-CSF to induce EMH. Data show white blood cell (WBC) (g), red blood cell (RBC) (h), and platelet (PLT) counts (i), numbers of CMPs (j), GMPs (k) and MEPs (l) in the bone marrow and numbers of GMPs in the spleen (m). n, Platelet counts of sham-operated and splenectomized mice that were treated with Cy+21d G-CSF one month after surgery. o-u, Tcf21cre/ER; Cxcl12fl/− mice and littermate controls (Cxcl12fl/− or Cxcl12+/−) were treated with tamoxifen then examined a month later without further treatment (NT) or after treatment with cyclophosphamide plus 4, 8, or 21 days of G-CSF to induce EMH. Data show WBC (o), RBC (p), and PLT counts (q), numbers of CMPs (r), GMPs (s) and MEPs (t) in the bone marrow and numbers of GMPs in the spleen (u). The numbers of mice per treatment are shown in each panel. All data reflect mean±s.d. from 3 independent experiments. Two-tailed student's t-tests were used to assess statistical significance (*P<0.05, ***P<0.001).

