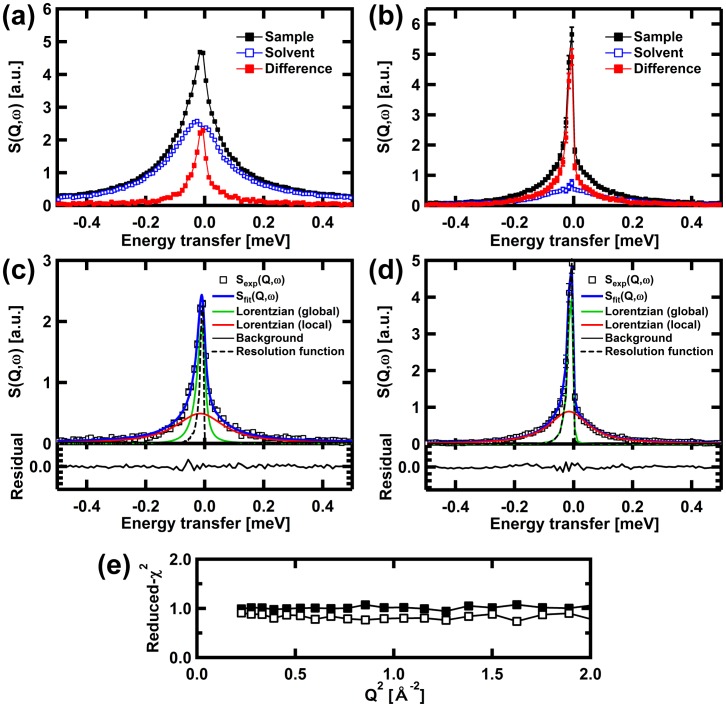
Fig 1. Examples of quasielastic neutron scattering spectra, S(Q,ω).
The spectra of the samples, the solvent, and the difference spectra between the sample and the solvent, of αSyn in (a) the monomeric state and (b) the fibril state, at Q = 1.225 Å-1 and at 280 K, are shown. Filled symbols in black and open symbols in blue show the spectra of the sample solutions and those of the solvent, respectively. The spectra of the empty cell were subtracted from these spectra. Filled symbols in red show the difference spectra between the sample and the solvent. (c) Fits using Eq 1 to the difference spectra, which are due to monomeric αSyn molecules in the sample solution. (d) Fits to the difference spectra, which are due to αSyn molecules in the fibril state. In the upper panels, open squares denote the data, thick solid lines in blue denote the total fits, solid lines in green and red denote the narrow and wide Lorentzian functions, corresponding to Lglobal(Q,ω) and Llocal(Q,ω), respectively, thin solid lines in blue show the background, and dashed lines in black show the resolution functions. The lower panels show the residuals of the fits. (e) Reduced-χ2 of the fits to the data. Filled squares and open squares are for the values to the data of αSyn in the monomeric state and the fibril state, respectively, at 280 K. Note that similar values of Reduced-χ2 were obtained for the data measured at other temperatures.

