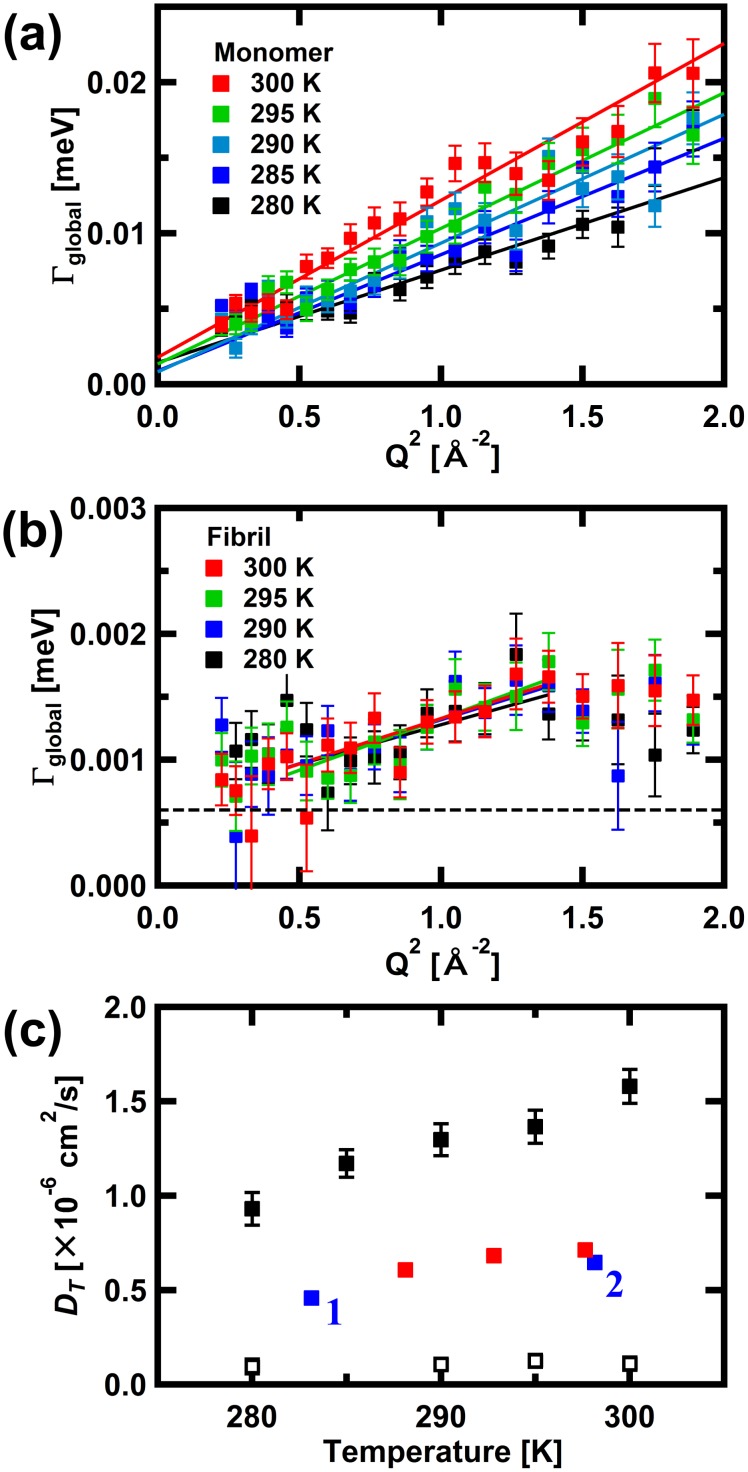
Fig 2.
Variations in the HWHM, Γglobal, of Lglobal(Q,ω) as a function of Q2 for αSyn in (a) the monomeric state and (b) the fibril state. Solid lines are the linear fits to the data, the slopes of which provide estimates of the effective diffusion coefficients, DT. The dashed line in (b) is 1/10 × HWHM for the resolution function. The error bars are within in symbols where not shown. (c) Summary of DT for αSyn. Filled and open squares in black are for the monomeric state and the fibril state, respectively. The filled squares in blue with subscripts 1 and 2 are the DT values estimated for αSyn in solution, reported in Refs. 40 and 41, respectively. Note that these values were corrected for the differences in solvent viscosity due to the different D2O concentration in the samples for the NMR measurements (6% and 10% D2O for Refs. 40 and 41, respectively) and the QENS measurements (100% D2O) in this study. Filled squares in red denote the DT values estimated from the DLS measurements on the αSyn solution under the condition similar to that employed for the QENS measurements (9.0 mg/ml αSyn in the PBS buffer in D2O) done in this study.

