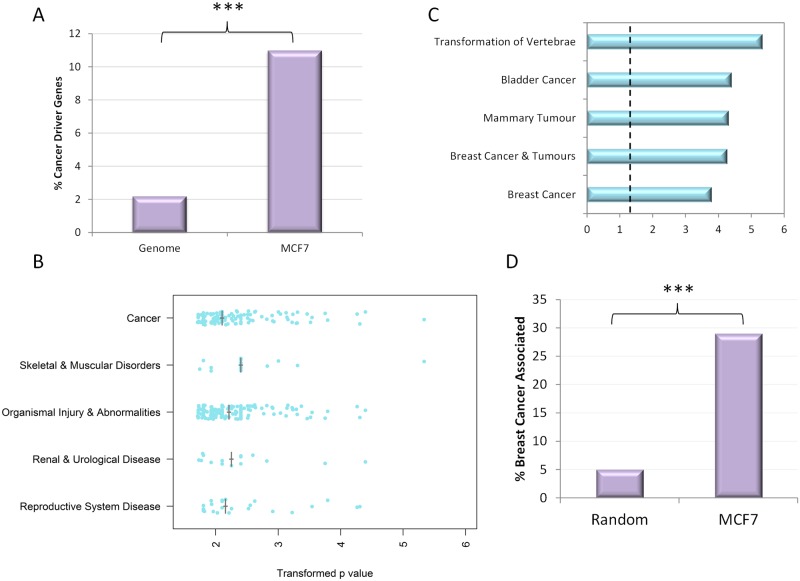
Fig 3. MCF-7 cancer association.
A: Percentage of top 100 insertion gene clusters that are cancer driver genes compared to the genome as a whole. B: IPA top processes groupings showing the range of transformed p values, with median indicated by grey cross. C: Top 5 ‘cancer’ subtypes identified by IPA with transformed p value shown. Dotted line represents p = 0.05. D: Percentage of the top 100 insertion gene clusters with known breast cancer annotation as determined by systematic literature review compared to a random set of 100 genes.

