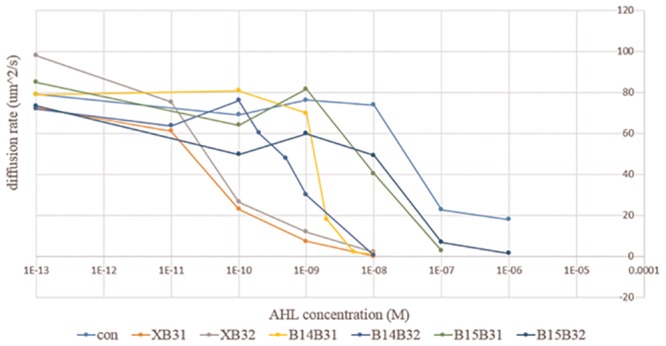
Fig 6. Comparing the effect of each brake component in response to different AHL concentrations.

All the brake components in the component library in Fig 3(b) were combined with a standard circuit and sent into E. coli strain RP5232 to measure their effect on population diffusion rate by the microfluidic device. Each line represents how a specific component influences the diffusion of bacteria in response to different AHL concentrations.
