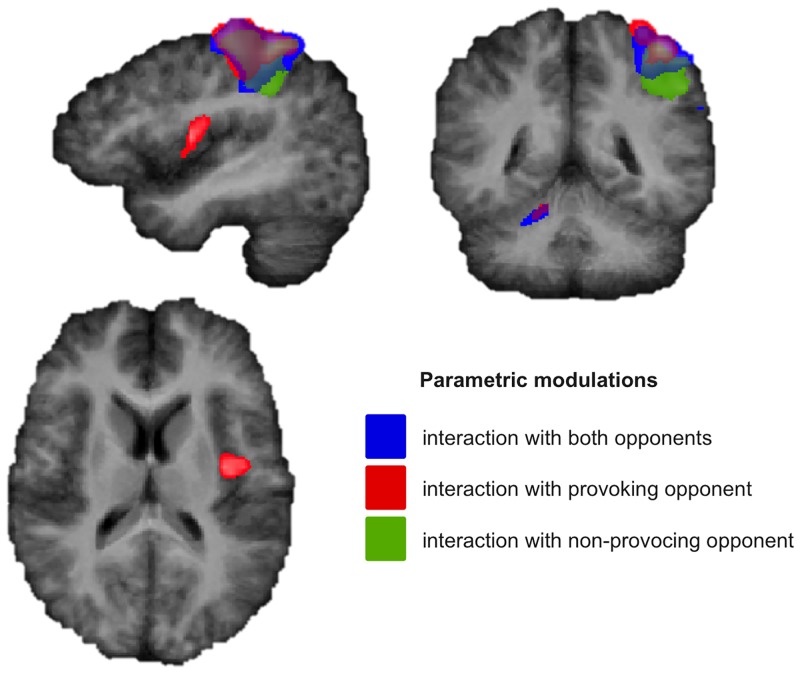
Fig 3. Parametric modulations.
Regions modulating their activity parametrically according to the displayed behavior, when interacting with both (blue), the provoking (red), or the non-provoking opponent (green) during the Taylor Aggression Paradigm. Statistical Maps: N = 15, p < .01, Cluster Threshold level corrected, radiological convention.

