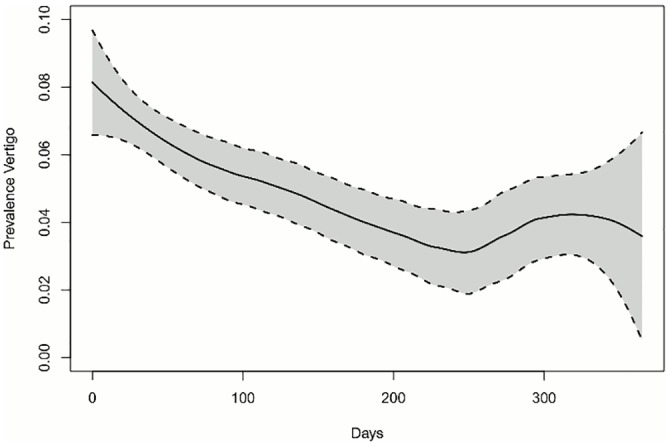
Fig 3. Trend of prevalence of vertigo.

The prevalence of MD episodes is illustrated over the first 365 days after inclusion in the study. The black line corresponds to the loess smoother with k = 0.75. The dotted line displays the pointwise 95%-confidence intervals of the smoother. We observed a decrease in MD episode prevalence over the first 240 days and an increase thereafter.
