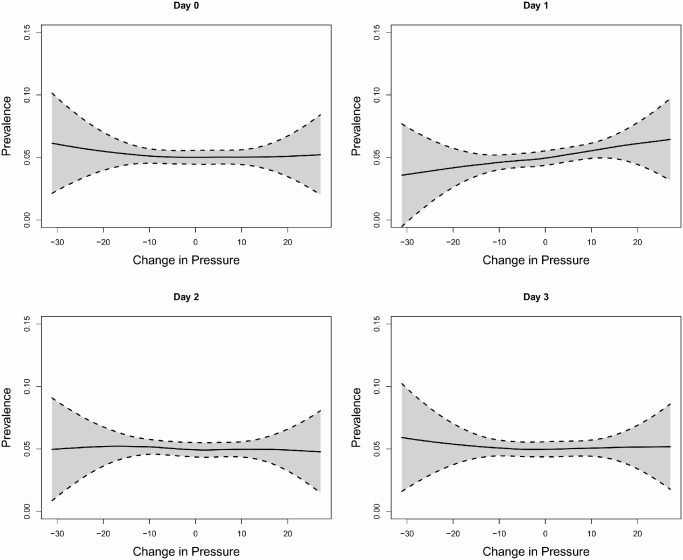
Fig 4. Change in atmospheric pressure versus prevalence of MD episodes.
Scatter plot of change in atmospheric pressure DiffPressure in hPa versus prevalence of MD episodes. The black line corresponds to the loess smoother with k = 0.75. No relationship between prevalence of MD episodes and change in air pressure could be observed for air pressure values on day zero, two and three, but a roughly linear increasing relationship was found between the onset of an MD episode and change in air pressure one day before the event.

